UML Activity Diagram
UML Activity Diagram is a type of UML diagrams, which illustrates the business and operational step-by-step workflows of components within a system and shows the overall flow of control. UML Activity Diagram is constructed from a limited number of shapes, connected each other with arrows. The most important shape types are rounded rectangles, diamonds, bars, black circle, encircled black circle. The arrows represent the order in which activities happen and run from the start towards the end. ConceptDraw PRO software enhanced with Rapid UML solution is ideal for software designers and software developers who need to draw the UML Activity Diagrams and other types of UML diagrams. It is convenient to use the appropriate stencils of UML notation from the UML Activity library included to the Rapid UML solution of ConceptDraw Solution Park and containing a lot of specific vector UML objects. Use them to design your own UML Activity Diagrams, make them colorful and attractive with style tools of ConceptDraw PRO software.Basic Flowchart Symbols and Meaning
Flowcharts are the best for visually representation the business processes and the flow of a custom-order process through various departments within an organization. ConceptDraw PRO diagramming and vector drawing software extended with Flowcharts solution offers the full set of predesigned basic flowchart symbols which are gathered at two libraries: Flowchart and Flowcharts Rapid Draw. Among them are: process, terminator, decision, data, document, display, manual loop, and many other specific symbols. The meaning for each symbol offered by ConceptDraw gives the presentation about their proposed use in professional Flowcharts for business and technical processes, software algorithms, well-developed structures of web sites, Workflow diagrams, Process flow diagram and correlation in developing on-line instructional projects or business process system. Use of ready flow chart symbols in diagrams is incredibly useful - you need simply drag desired from the libraries to your document and arrange them in required order. There are a few serious alternatives to Visio for Mac, one of them is ConceptDraw PRO. It is one of the main contender with the most similar features and capabilities.
Agile Methodology
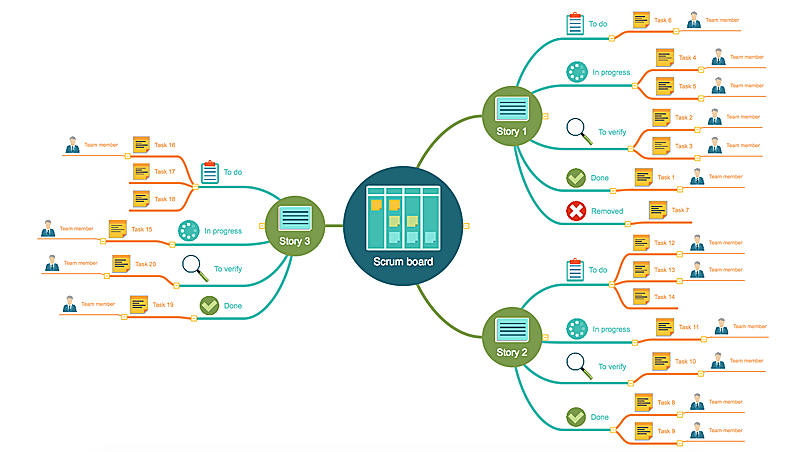
Agile methodology is an excellent alternative to waterfall and traditional sequential development. ConceptDraw PRO software extended with SCRUM Workflow solution is ideal for quick and easy designing various diagrams, charts, mind maps and schematics illustrating software development using Agile methodologies, and in particular Scrum methodology.HelpDesk
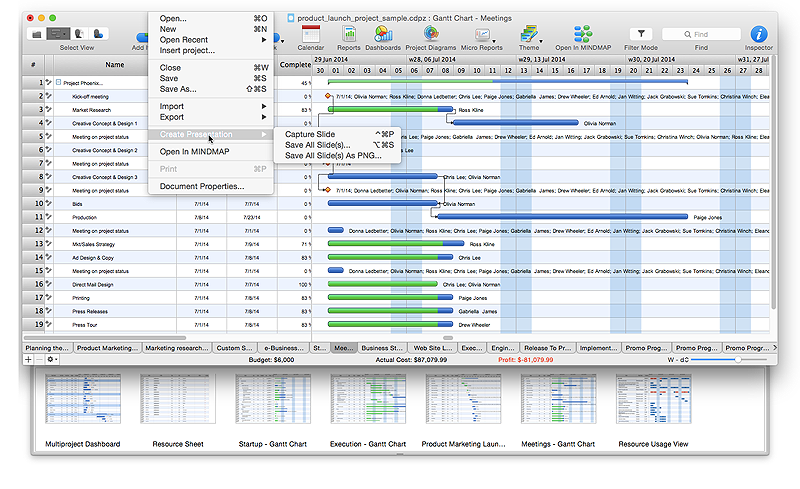
How to Get Images for Project Presentation on Macintosh
ConceptDraw PROJECT allows you to easily make slides for presentation.HelpDesk
Agile Mind Maps: Exploring the User Wishes
Agile method advocate use cases and user stories, but there are no standard processes or guides available to help gather user requirements. That is why documenting user requirements can be challenging. Without strong communication experience the scrum process can collapse, leading towards unfruitful requirements and imperfect software. This article offers a path to overcome these hurdles through the simplicity and clearness of mind mapping. ConceptDraw Scrum Worflow solution lets explore the user requirements for your Agile development project before they are formalized. You can easily create professional Mind Maps that will effectively collect and structure the information on what a user actually wants, or the “User Wish.”Ansoff Matrix
ConceptDraw PRO software extended with Matrices Solution from the Marketing Area of ConceptDraw Solution Park offers you the possibility to develop the Ansoff Matrix of any complexity.
 ConceptDraw Solution Park
ConceptDraw Solution Park collects graphic extensions, examples and learning materials
 iPhone User Interface
iPhone User Interface solution extends ConceptDraw PRO v10 software with templates, samples and libraries with large quantity of vector stencils of graphical user interface elements, Apps icons, UI patterns for designing and prototyping of the iOS applic
UML Activity Diagram. Design Elements
UML Activity Diagram illustrate the business and operational step-by-step workflow of components in a system and shows the overall flow of control.
Entity Relationship Diagram - ERD - Software for Design Crows Foot ER Diagrams
ER-model is a data model which lets describe the conceptual schemes in a specific subject area. It can help to highlight the key entities and specify relationships that can be established between these entities. During the database design, it is realized the transformation of ER model into certain database scheme based on the chosen data model (relational, object, network, etc.). There are used two notations for ERDs: Crow's Foot and Chen's. Crow's Foot notation proposed by Gordon Everest represents the entity by rectangle containing its name (name must be unique within this model), and relation - by the line which links two entities involved in relationship. The relationship's plurality is graphically indicated by a "plug" on the end of the link, the optionality - by a circle. Entity-Relationship Diagrams based on Crow's Foot notation can be easily drawn using the ConceptDraw PRO. Extended with Entity-Relationship Diagram (ERD) solution, it is the best ERD diagrams software with powerful tools and ready design elements for Crow's Foot and Chen notations.
HelpDesk
How to Create a Timeline Diagram in ConceptDraw PRO
A Timeline is a chart which displays a project plan schedule in chronological order. A Timeline is used in project management to depict project milestones and visualize project phases, and show project progress. The graphic form of a timeline makes it easy to understand critical project milestones, such as the progress of a project schedule. Timelines are particularly useful for project scheduling or project management when accompanied with a Gantt chart. It captures the main of what the project will accomplish and how it will be done. making a project timeline is one of the most important skills a project manager needs have. Making comprehensive, accurate timelines allows you getting every project off in the best way. ConceptDraw PRO allows you to draw a timeline charts using special library.HelpDesk
How to Draw a Circular Arrows Diagram Using ConceptDraw PRO
The cyclic recurrence is a fundamental property of multiple systems. The cycle is a process which consists from elements (phases, stages, stages) following each other. Many processes in astronomy, biology, chemistry, physics, mathematics, etc. have a cycle properties. It is also widely used in information technologies and marketing analysis. Graphical representation of cyclic processes can have many forms. It can be a circle, parabola, hyperbola, ellipse and others. A Circular Arrows Diagram is used as one of the statistical charts in the business, mass media and marketing. ConceptDraw PRO provides its users tools for making easy drawing Circular Arrows Diagrams.- Conceptdraw.com: Mind Map Software, Drawing Tools | Project ...
- Marketing mix - Wheel diagram | Target diagrams - Vector stencils ...
- Goal Png
- Venn diagram - Path to sustainable development
- Erd Is Software Project Development
- Example Of A Grant Chart For Website Development
- Donut Chart Templates | Pie Chart Examples and Templates ...
- Competitor Analysis | Block diagram - Porter's five forces model ...
- How To Convert a Circle -Spoke Diagram to an Adobe PDF Using ...
- Project Report Charts
- Arrow Logo Full Hd Pc Png
- Gantt chart examples | Gant Chart in Project Management | Process ...
- Pie Chart Software | How to Draw a Pie Chart Using ConceptDraw ...
- UML Use Case Diagram Example Social Networking Sites Project ...
- How to Draw a Pie Chart Using ConceptDraw PRO | Process ...
- Pie Chart Software | How to Draw a Pie Chart Using ConceptDraw ...
- Software development with ConceptDraw PRO | How to Create an ...
- How to Plan and Allocate Resources in Your Project on Mac | Gant ...
- JSD - Jackson system development | Human Resource ...
- Pyramid Diagram | Pyramid Diagram | Process Flowchart | Chart Of ...


_Win_Mac.png)

