HelpDesk
How to Create a Timeline Diagram in ConceptDraw PRO
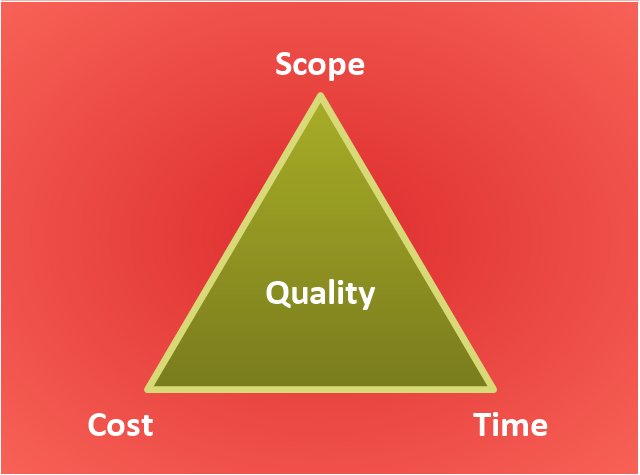
A Timeline is a chart which displays a project plan schedule in chronological order. A Timeline is used in project management to depict project milestones and visualize project phases, and show project progress. The graphic form of a timeline makes it easy to understand critical project milestones, such as the progress of a project schedule. Timelines are particularly useful for project scheduling or project management when accompanied with a Gantt chart. It captures the main of what the project will accomplish and how it will be done. making a project timeline is one of the most important skills a project manager needs have. Making comprehensive, accurate timelines allows you getting every project off in the best way. ConceptDraw PRO allows you to draw a timeline charts using special library."The Project Management Triangle (called also Triple Constraint or the Iron Triangle) is a model of the constraints of project management. It is a graphic aid where the three attributes show on the corners of the triangle to show opposition. It is useful to help with intentionally choosing project biases, or analyzing the goals of a project. It is used to illustrate that project management success is measured by the project team's ability to manage the project, so that the expected results are produced while managing time and cost." [Project management triangle. Wikipedia]
The pyramid chart example "Project management triangle diagram" was redesigned using the ConceptDraw PRO diagramming and vector drawing software from Wikimedia Commons file Project-triangle-en.svg. [commons.wikimedia.org/ wiki/ File:Project-triangle-en.svg]
The project management triangle chart example is included in the Pyramid Diagrams solution from the Marketing area of ConceptDraw Solution Park.
- Block Diagram Of Project Management
- Program to Make Flow Chart | Innovation life cycle - Arrow loop ...
- What Is Er Diagram Sample Project Management System
- Activities In A Project Management Software With Example Diagram
- Activity Network Diagram Method | How to Create Presentation of ...
- UML Use Case Diagram Example Social Networking Sites Project ...
- Networking Design For Bank Project Flow Diagram
- Network Diagram In Project Management Examples
- Project Management Structure Diagram
- How to Add a Block Diagram to a PowerPoint Presentation Using ...
- Software Work Flow Process in Project Management with Diagram ...
- UML Deployment Diagram | UML Use Case Diagram Example ...
- Block Diagram Of Software Project Management
- Activity Diagram For Social Networking Site Project
- Software Work Flow Process in Project Management with Diagram ...
- Software Work Flow Process in Project Management with Diagram ...
- Project Network Diagram Example Of Software Project
- Block diagram - Planning process | Auditing Process. Audit Planning ...
- Basic CCTV System Diagram . CCTV Network Diagram Example ...
- UML Sample Project | UML 2 4 Process Flow Diagram | UML Use ...

