Concept Mapping
Being usually a very complex process that requires a lot of skills, patience, time, and artistic abilities, the concept mapping process now is incredibly easy thanks to the Concept Maps Solution from the "Diagrams" Area of ConceptDraw Solution Park.Concept Map
A concept map is a way of representing relationships between ideas, images, or words. How to draw a Concept Map quick, easy and effective? ConceptDraw PRO offers the unique Concept Maps Solution from the "Diagrams" Area that will help you!Process Flowchart
The main reason of using Process Flowchart or PFD is to show relations between major parts of the system. Process Flowcharts are used in process engineering and chemical industry where there is a requirement of depicting relationships between major components only and not include minor parts. Process Flowcharts for single unit or multiple units differ in their structure and implementation. ConceptDraw PRO is Professional business process mapping software for making Process flowcharts, Process flow diagram, Workflow diagram, flowcharts and technical illustrations for business documents and also comprehensive visio for mac application. Easier define and document basic work and data flows, financial, production and quality management processes to increase efficiency of your business with ConcepDraw PRO. Business process mapping software with Flowchart Maker ConceptDraw PRO includes extensive drawing tools, rich examples and templates, process flowchart symbols and shape libraries, smart connectors that allow you create the flowcharts of complex processes, process flow diagrams, procedures and information exchange. Process Flowchart Solution is project management workflow tools which is part ConceptDraw Project marketing project management software. Drawing charts, diagrams, and network layouts has long been the monopoly of Microsoft Visio, making Mac users to struggle when needing such visio alternative like visio for mac, it requires only to view features, make a minor edit to, or print a diagram or chart. Thankfully to MS Visio alternative like ConceptDraw PRO software, this is cross-platform charting and business process management tool, now visio alternative for making sort of visio diagram is not a problem anymore however many people still name it business process visio tools.
ConceptDraw Arrows10 Technology
How should diagramming software work? The answer is - Fast and easy. "Tree"- mode drawing works like that. Just select objects in your drawing and press Tree or Chain button to connect all of them just in one click. Your diagram looks professional and it took only a moment to draw.
 Concept Maps
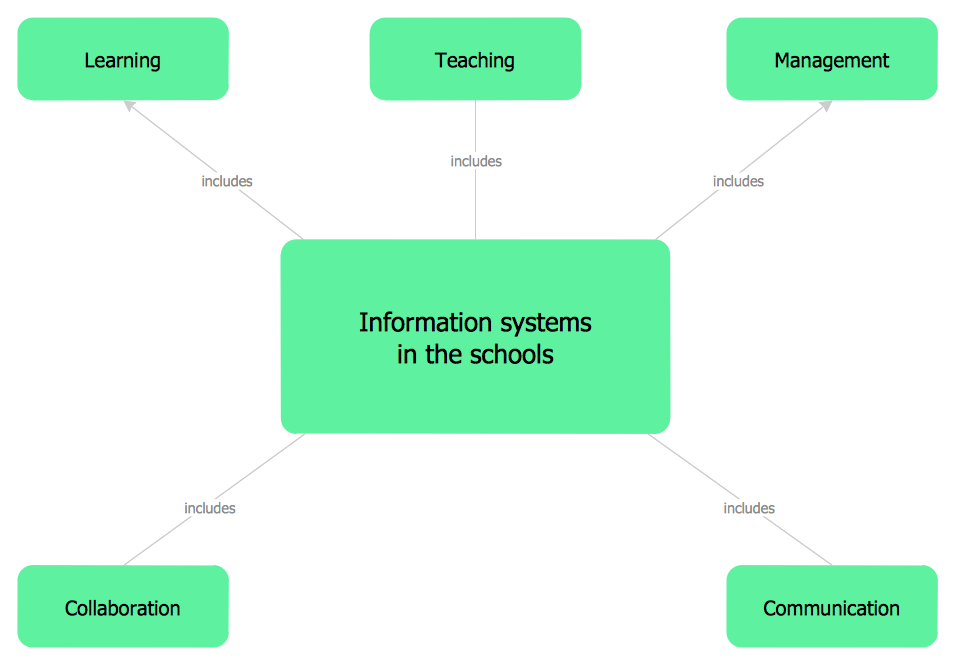
The technique of concept mapping was developed as a constructive way of representing knowledge in science and increasing the meaningfulness of learning. Now, the creation of a concept map is extremely helpful when used in education as learning and teaching techniques that assist memorization. Concept maps are also used for idea generation in brainstorming sessions, and for detailing the structure of complex ideas.
How To Make a Concept Map
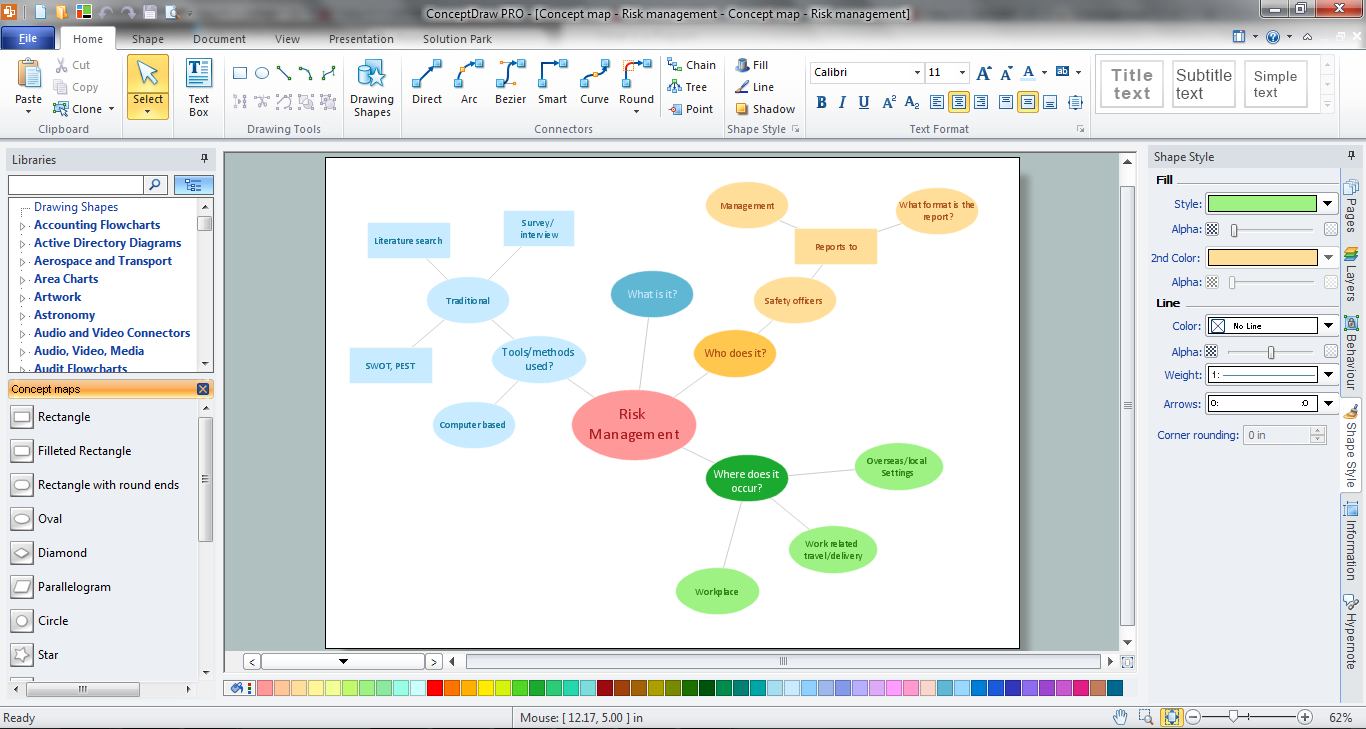
How to make a Concept Map fast and easy? ConceptDraw PRO diagramming and vector drawing software extended with Concept Maps Solution from the "Diagrams" Area is the best choice for those who want design professional looking Concept Map in minutes.Physics Symbols
ConceptDraw PRO diagramming and vector drawing software extended with Physics solution from the Science and Education area is a powerful software for creating various physics diagrams. Physics solution provides all tools that you can need for physics diagrams designing. It includes 3 libraries with predesigned vector physics symbols: Optics Library, Mechanics Library and Nuclear Physics Library.Technical Flow Chart
Flow chart is a diagrammatic representation of an algorithm and essential part of planning the system. Flow charts are widely used in technical analysis and programming for easy writing programs and explaining them to others. So, one of the most popular type of flow charts is Technical Flow Chart. Technical Flow Chart can be drawn by pencil on the paper, but it will be easier to use for designing a special software. ConceptDraw PRO diagramming and vector drawing software extended with Flowcharts Solution from the "Diagrams" Area of ConceptDraw Solution Park will be useful for this goal.Business Process Flowchart
Cross-functional (deployment) flowcharts visualize what functional units (people, departments or functional areas) are responsible for the business process operations. The flowcharts are divided into rows/columns of functional units. Blocks of various shapes represent the process steps, and are placed in rows/columns of the responsible functional units.Sentence Diagram
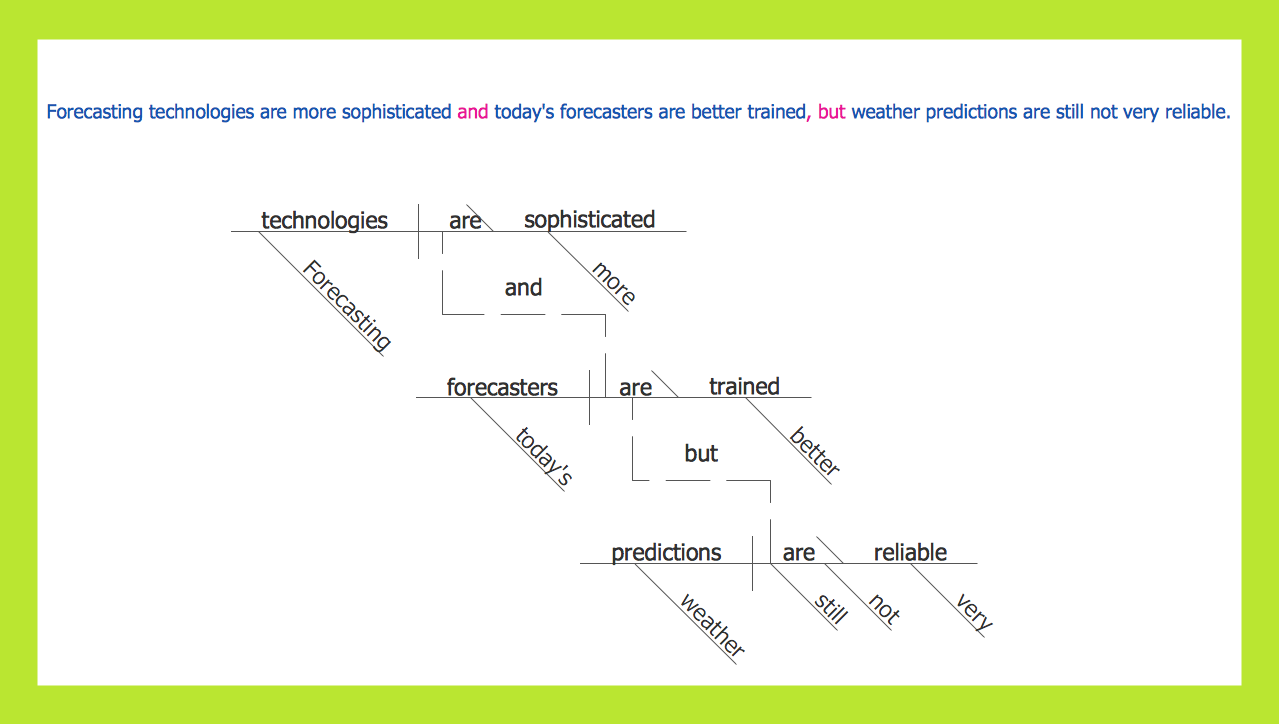
In pedagogy and theoretical syntax, a sentence diagram or parse tree is a pictorial representation of the grammatical structure of a sentence. The term "sentence diagram" is used more in pedagogy, where sentences are diagrammed. ConceptDraw PRO diagramming and vector drawing software extended with Language Learning solution from the Science and Education area is ideal for quick and easy drawing sentence diagrams of any complexity.Mathematical Diagrams
ConceptDraw PRO diagramming and vector drawing software extended with Mathematics solution from the Science and Education area is the best for creating: mathematical diagrams, graphics, tape diagrams various mathematical illustrations of any complexity quick and easy. Mathematics solution provides 3 libraries: Plane Geometry Library, Solid Geometry Library, Trigonometric Functions Library.Biology Drawing
It is impossible to imagine the biology science without drawings. Drawings are very convenient way to explain the different biological knowledge and processes. If you dream to design any biology drawing quick and easy – the ConceptDraw PRO software is exactly what you need. ConceptDraw PRO diagramming and vector drawing software extended with Biology solution from the Science and Education area offers the useful tools for easy biology drawing.Solar System Symbols
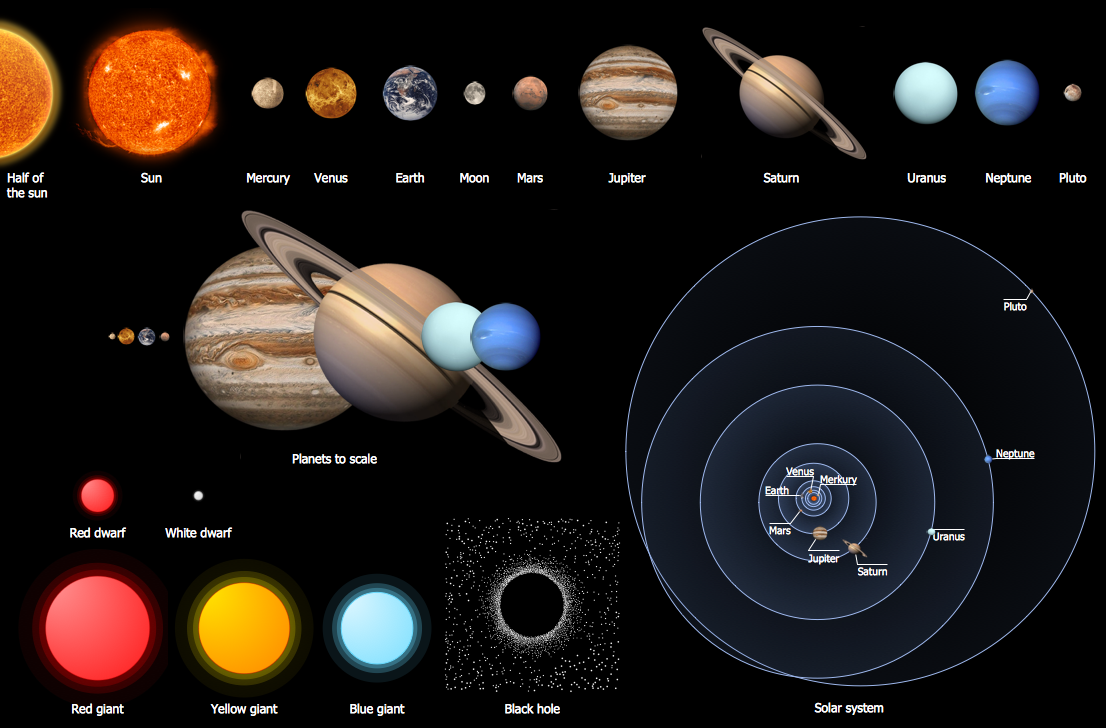
Astronomy solution provides the Stars and Planets library with wide variety of solar system symbols. You can find here vector objects of solar system, of stars and planets of the universe. To quickly draw any astronomy illustration: create new document and simply drag the needed solar system symbols from the Stars and Planets library, arrange them and add the text. You can also use the predesigned templates and samples from the ConceptDraw STORE as the base for your own sun solar system illustrations, astronomy and astrology drawings.What Is a Line Chart
What Is a Line Chart? A line chart is a basic type of chart represented by a series of data points connected with a straight line. Explaining the meaning of “What is a line chart?” is convenient to use illustrations with professional looking line charts designed in ConceptDraw PRO diagramming and vector drawing software extended with Line Graphs solution from the Graphs and Charts area.- Psychological Learning Mind Map
- Psychological Mind Map
- The Best Choice for Creating Diagram | ConceptDraw Arrows10 ...
- Swot In Psychology
- Mind Map Food | Hamburger | Mind Mapping in the Quality ...
- Concept Mapping | Concept Maps | Chemistry Drawings | Mind Map ...
- Biology Drawing | Concept Maps | Psychology Swot Analysis
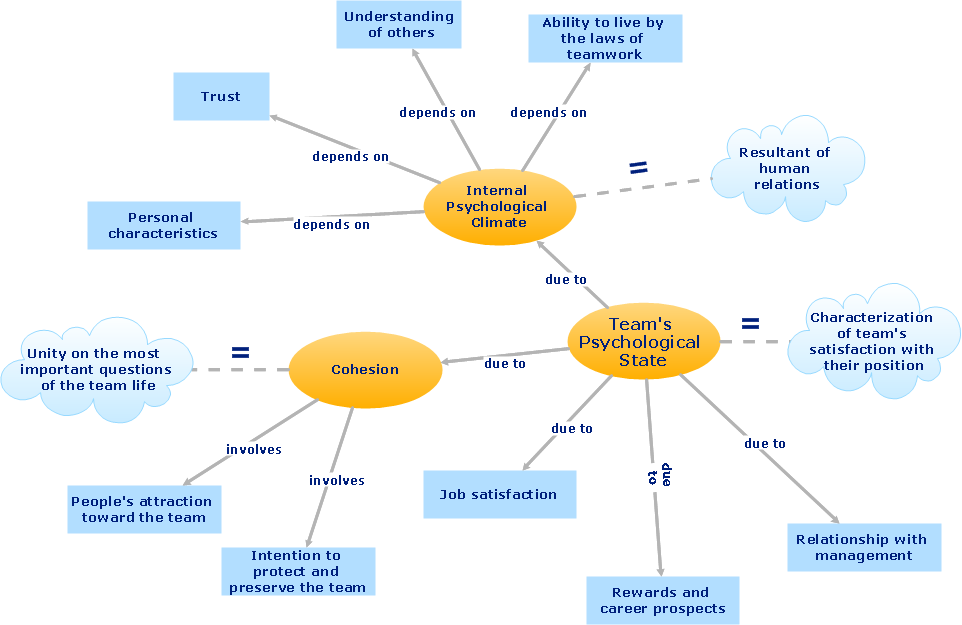
- Team psychological characteristics - Concept map | Safety and ...
- Hamburger | Mind Map Food | Mind Mapping in the Quality ...
- Cognitive Psychology Mind Map
- Mind Map About Good Mental Health
- Mind Map About Disaster Risk Reduction
- Mind Map Goal Setting Diagram
- Hamburger | Food - Vector stencils library | Mind Map Food ...
- Psychology Perspective Concept Map
- Educational Psychology Map
- Leadership Mind Map
- Concept map - Team psychological characteristics | Block Diagrams ...
- Block Diagrams | Sample Of Creative Swot Analysis In Psychology
- Safety and Security | Team psychological characteristics - Concept ...
