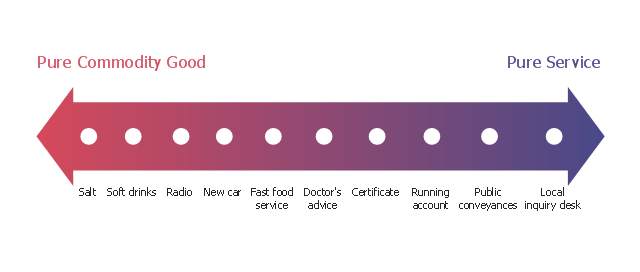
"The dichotomy between physical goods and intangible services is an oversimplification; these are not discrete categories. Most business theorists see a continuum with pure service at one endpoint and pure commodity goods at the other endpoint. Most products fall between these two extremes. Goods are normally structural and can be transferred in an instant while services are delivered over a period of time. Goods can be returned while a service once delivered cannot. Goods are not always tangible and may be virtual." [Goods and services. Wikipedia]
The example "Service-goods continuum diagram" was created using the ConceptDraw PRO diagramming and vector drawing software extended with the Marketing Diagrams solution from the Marketing area of ConceptDraw Solution Park.
The example "Service-goods continuum diagram" was created using the ConceptDraw PRO diagramming and vector drawing software extended with the Marketing Diagrams solution from the Marketing area of ConceptDraw Solution Park.
Service-goods continuum
HelpDesk
How to Add a Block Diagram to a PowerPoint Presentation Using ConceptDraw PRO

Graphic Technologies

 Marketing Diagrams
Marketing Diagrams solution extends ConceptDraw PRO diagramming software with abundance of samples, templates and vector design elements intended for easy graphical visualization and drawing different types of Marketing diagrams and graphs, including Branding Strategies Diagram, Five Forces Model Diagram, Decision Tree Diagram, Puzzle Diagram, Step Diagram, Process Chart, Strategy Map, Funnel Diagram, Value Chain Diagram, Ladder of Customer Loyalty Diagram, Leaky Bucket Diagram, Promotional Mix Diagram, Service-Goods Continuum Diagram, Six Markets Model Diagram, Sources of Customer Satisfaction Diagram, etc. Analyze effectively the marketing activity of your company and apply the optimal marketing methods with ConceptDraw PRO software.
- Service - goods continuum diagram | Pure Good Continuum
- Service - goods continuum diagram | Pyramid Diagram | Competitor ...
- Service- goods continuum diagram | Define Pure Service And ...
- Service- goods continuum diagram | Pure Service Explain The ...
- What Is Pure Service
- Service - goods continuum diagram | Goods Service Continuum ...
- Service - goods continuum diagram | Marketing Diagrams | Good ...
- Service - goods continuum diagram | Flow chart Example ...
- Service - goods continuum diagram | Marketing Diagrams | What Is ...
- Service - goods continuum diagram | Marketing Diagrams | Example ...
- Service - goods continuum diagram | Tangible And Service Products ...
- Service - goods continuum diagram | Product And Services Continum
- Workflow Process Example | Service - goods continuum diagram ...
- Service - goods continuum diagram | Marketing Diagrams | Process ...
- Service - goods continuum diagram | Flowchart Marketing Process ...
- Service - goods continuum diagram | Process Flowchart | Pyramid ...
- Service - goods continuum diagram | Leaky bucket diagram ...
- Service - goods continuum diagram | Pyramid Diagram | Marketing ...
- Service - goods continuum diagram | Copying Service Process ...
- Service - goods continuum diagram | Process Flowchart | Marketing ...