 Pyramid Diagrams
Pyramid Diagrams solution extends ConceptDraw PRO software with templates, samples and library of vector stencils for drawing the marketing pyramid diagrams.
 Total Quality Management TQM Diagrams
Total Quality Management Diagrams solution extends ConceptDraw PRO software with samples, templates and vector stencils library for drawing the TQM flowcharts.
HelpDesk
How to Draw a Pyramid Diagram in ConceptDraw PRO
Pyramid diagram (triangle diagram) is used to represent data, which have hierarchy and basics. Due to the triangular form of diagram, each pyramid section has a different width. The width of the segment shows the level of its hierarchy. Typically, the top of the pyramid is the data that are more important than the base data. Pyramid scheme can be used to show proportional and hierarchical relationships between some logically related items, such as departments within an organization, or successive elements of any process. This type of diagram is often used in marketing to display hierarchical related data, but it can be used in a variety of situations. ConceptDraw PRO allows you to make a pyramid diagram, quickly and easily using special libraries.
 Business Process Model and Notation
Business Process Model and Notation Solution for ConceptDraw PRO is helpful for modeling the business processes of any degree of complexity, documenting them and effective creating diagrams using the BPMN 2.0 standard.
 Seven Basic Tools of Quality
Manage quality control in the workplace, using fishbone diagrams, flowcharts, Pareto charts and histograms, provided by the Seven Basic Tools of Quality solution.
 Quality Mind Map
This solution extends ConceptDraw MINDMAP software with Quality Management Mind Maps (Presentations, Meeting Agendas, Problem to be solved).
 Health Food
The Health Food solution contains the set of professionally designed samples and large collection of vector graphic libraries of healthy foods symbols of fruits, vegetables, herbs, nuts, beans, seafood, meat, dairy foods, drinks, which give powerful possi
HelpDesk
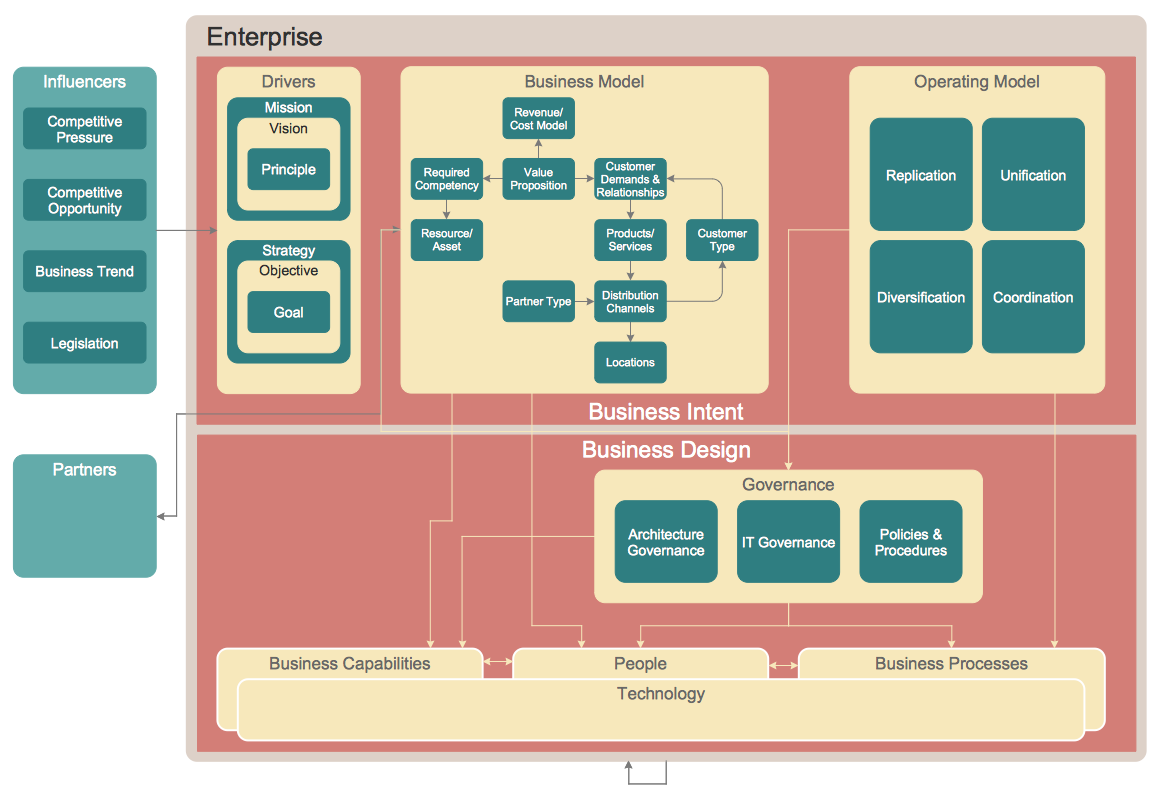
How to Create an Enterprise Architecture Diagram in ConceptDraw PRO
An Enterprise Architecture (EA) diagram is used to display the structure and operations of an organization.It is used to analyze and document an organization and its business functions, along with the applications and systems on which they are implemented. The aim of an enterprise architecture diagram is to determine how an organization can effectively achieve its current and future objectives. The Enterprise Architecture often uses diagrams to support the decision-making process. ConceptDraw PRO allows you to design Enterprise Architecture diagrams of any complexity.- Tqm Pyramid Model
- Types Of Tqm Models
- Process Flowchart | Total Quality Management Value | Pyramid ...
- Organizational Structure Total Quality Management | Organizational ...
- Pyramid Diagram | Total Quality Management Value | TQM Diagram ...
- Total Quality Management TQM Diagrams
- Process Flowchart | Pyramid Diagram | Pyramid Diagram | Mind Map ...
- Pyramid Diagram | Organizational Structure | Organizational ...
- Pyramid Diagram | Pyramid Diagram | Software Work Flow Process ...
- Pyramid Diagram | Organizational Structure Total Quality ...
- Process Flowchart | Total Quality Management Value | Pyramid ...
- Different Types Of Tqm Models
- TQM Diagram Tool | Pyramid Diagram | Total Quality Management ...
- Quality System Pyramid Diagram
- Pyramid Diagram | Pyramid Diagrams | Structured Systems Analysis ...
- Drawing Of Total Quality Management Model
- 4 Level pyramid model diagram - Information systems types ...
- Pyramid Diagram and Pyramid Chart | Pyramid Chart Examples ...
- Pyramid Diagram | Pyramid Diagram | 4 Level pyramid model ...
- Identifying Quality Management System | Pyramid Diagram ...

