Best Value — Total Quality Management
The Total Quality Management Diagram solution helps your organization visualize business and industrial processes. Create Total Quality Management diagrams for business process with ConceptDraw software.Organizational Structure Total Quality Management
The Total Quality Management Diagram solution helps you and your organization visualize business and industrial processes. Create Total Quality Management diagrams for business process with ConceptDraw software.Best Value Stream Mapping mac Software
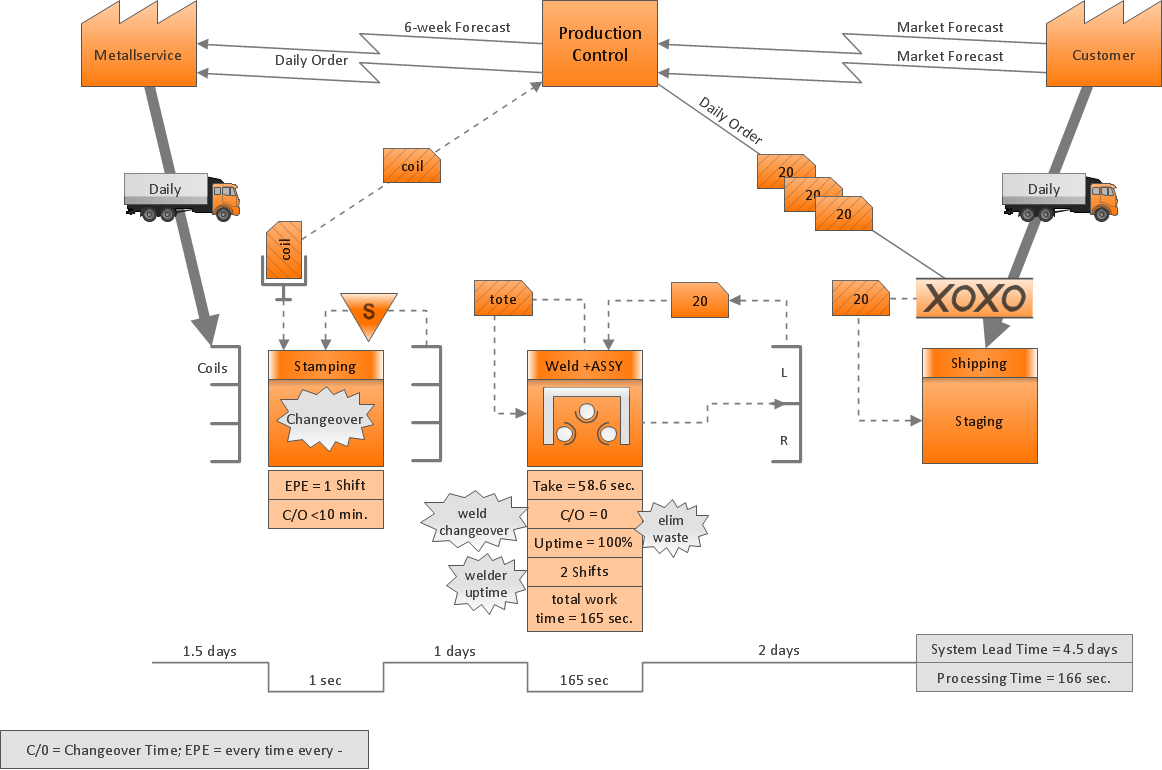
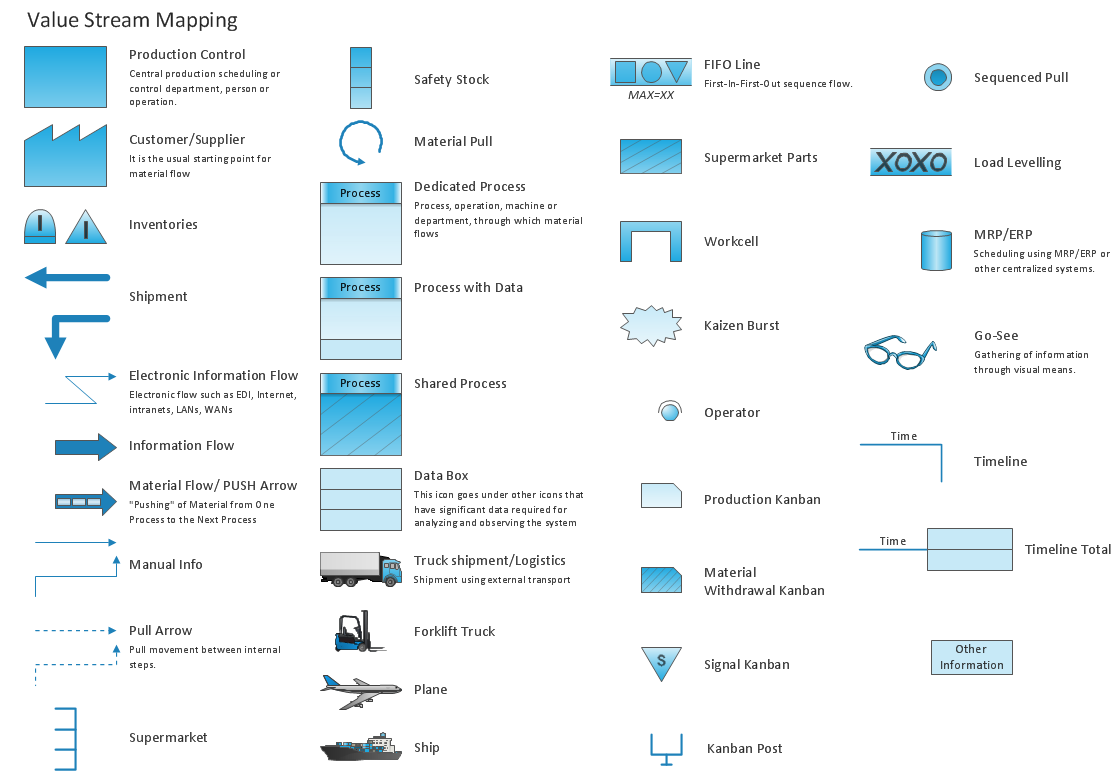
Create value stream maps - for value stream analysis and value stream management, material and information flow mapping, using our quick start templates included with ConceptDraw.Standard Shapes for Value Stream Mapping
ConceptDraw Value Stream Mapping solution extends software with templates, samples and vector shapes for drawing Value Stream Maps (VSM).
 ConceptDraw Solution Park
ConceptDraw Solution Park collects graphic extensions, examples and learning materials
 Value Stream Mapping
Value stream mapping solution extends ConceptDraw PRO software with templates, samples and vector stencils for drawing the Value Stream Maps (VSM) in lean manufacturing practice.
 Total Quality Management TQM Diagrams
Total Quality Management Diagrams solution extends ConceptDraw PRO software with samples, templates and vector stencils library for drawing the TQM flowcharts.
 Quality
This solution extends ConceptDraw PRO v9 and ConceptDraw MINDMAP v7 with Quality Management Diagrams (Total Quality Management Diagrams, Timelines, Workflows, Value Stream Maps) and Mind Maps (Presentations, Meeting Agendas, Problem to be solved).
 Quality Mind Map
This solution extends ConceptDraw MINDMAP software with Quality Management Mind Maps (Presentations, Meeting Agendas, Problem to be solved).
 Seven Basic Tools of Quality
Manage quality control in the workplace, using fishbone diagrams, flowcharts, Pareto charts and histograms, provided by the Seven Basic Tools of Quality solution.
Lean Six Sigma Diagram Software
Lean Six Sigma (LSS) is a well-known in all over the world methodology of quality improvement and business perfection. ConceptDraw PRO diagramming and vector drawing software is a powerful Lean Six Sigma Diagram Software thanks to the included Value Stream Mapping solution from the Quality Area of ConceptDraw Solution Park.
 Education Mind Maps
This solution extends ConceptDraw MINDMAP software with scientific and educational mind maps for educational documents, presentations, and websites.
 Biology
Biology solution extends ConceptDraw PRO software with samples, templates and libraries containing biological vector symbols, to help you create scientific and educational designs in the field of biology.
- Flow Chart Related To Value Education
- Total Quality Management Value
- Best Value — Total Quality Management | Identifying Quality ...
- Total Quality Management Value | Total Quality Management ...
- How to Create a Fishbone (Ishikawa) Diagram Quickly | How To ...
- Total Quality Management TQM Diagrams | How to Create a TQM ...
- How to Create a Fishbone (Ishikawa) Diagram Quickly | Draw ...
- Swim Lanes Flowchart. Flowchart Examples | Total Quality ...
- Quality Project Management with Mind Maps | Total Quality ...
- Total Quality Management TQM Diagrams | Process Flowchart ...
- Quality Management Teams | Total Quality Management Value ...
- Draw The Flow Chart Of Value Education
- Influence Diagram Software | Influence Diagram | Types of ...
- Organizational Structure Total Quality Management | Best Value ...
- Quality Mind Map | Process Flowchart | Value -Stream Mapping for ...
- Food Court | TQM Diagram — Professional Total Quality ...
- Total Quality Management TQM Diagrams | Visual Presentations ...
- Universal Diagramming Area | In searching of alternative to MS Visio ...
- Basic Flowchart Symbols and Meaning | Process Flowchart | Total ...
- Ishikawa Diagram | Draw Fishbone Diagram on MAC Software ...


