Organizational Structure Total Quality Management
The Total Quality Management Diagram solution helps you and your organization visualize business and industrial processes. Create Total Quality Management diagrams for business process with ConceptDraw software.A Study of the Business Value of Total Quality Management
The Total Quality Management Diagram solution helps your organization visualize business and industrial processes. Create Total Quality Management diagrams for business process with ConceptDraw software.Basic of Flowchart: Meaning and Symbols
Flowcharts are the best for visually representation the business processes and the flow of a custom-order process through various departments within an organization. ConceptDraw DIAGRAM diagramming and vector drawing software extended with Flowcharts solution offers the full set of predesigned basic flowchart symbols which are gathered at two libraries: Flowchart and Flowcharts Rapid Draw. Among them are: process, terminator, decision, data, document, display, manual loop, and many other specific symbols. The meaning for each symbol offered by ConceptDraw gives the presentation about their proposed use in professional Flowcharts for business and technical processes, software algorithms, well-developed structures of web sites, Workflow diagrams, Process flow diagram and correlation in developing on-line instructional projects or business process system. Use of ready flow chart symbols in diagrams is incredibly useful — you need simply drag desired from the libraries to your document and arrange them in required order. There are a few serious alternatives to Visio for Mac, one of them is ConceptDraw DIAGRAM. It is one of the main contender with the most similar features and capabilities.
How To Create a Flow Chart in ConceptDraw
ConceptDraw DIAGRAM is a flowchart creating software. This software includes over 20 vector stencils in libraries. These objects allow you to create well-designed flowcharts. Put an initial object from library to a page and use RapidDraw technology clicking on direction arrows to add new objects to the flowchart. This way you can make flowchart quickly.Audit Steps
Audit Steps - The auditing process is an independent examination of data, statements, operations, records, financial or otherwise performances of an enterprise for any stated purpose. It is a complex process that includes 10 audit steps: Notification, Planning, Opening Meeting, Fieldwork, Communication, Draft Audit, Management Response, Final Meeting, Report Distribution, Feedback.
 Quality Mind Map
In order to create any needed mind map, the ConceptDraw DIAGRAM diagramming and drawing software can be used. The Quality Mind Map solution provides the pre-made quality mind map templates, samples and stencil libraries full of design elements. Having such great starting points for identifying, tracking and addressing all the quality initiatives in your organization, you can start using the Quality Mind Map solution right now editing the existing examples and so creating the unique and good-looking drawings. It is useful for a wide range of business specialists, analysts, project managers, creative managers, project members, marketers, teachers and many other specialties.
 Plan-Do-Check-Act (PDCA)
Plan-Do-Check-Act (PDCA) solution extends the ConceptDraw DIAGRAM software with collection of samples and predesigned vector objects for easy visualization four stages of PDCA cycle, PDSA cycle, or Deming cycle, for illustration effective application of this method to the practical business tasks, for depiction the implementation of changes and solution the problems in business processes. Plan-Do-Check-Act (PDCA) solution helps to design professional-looking and attractive Plan Do Study Act diagrams, PDCA cycle diagrams, PDCA Process diagrams, and to construct the Quality Management Process Models, which all assist to manage efficiently the business processes, to improve quality of work and to reduce significantly the costs.
 Business Package for Management
Package intended for professional who designing and documenting business processes, preparing business reports, plan projects and manage projects, manage organizational changes, prepare operational instructions, supervising specific department of an organization, workout customer service processes and prepare trainings for customer service personal, carry out a variety of duties to organize business workflow.
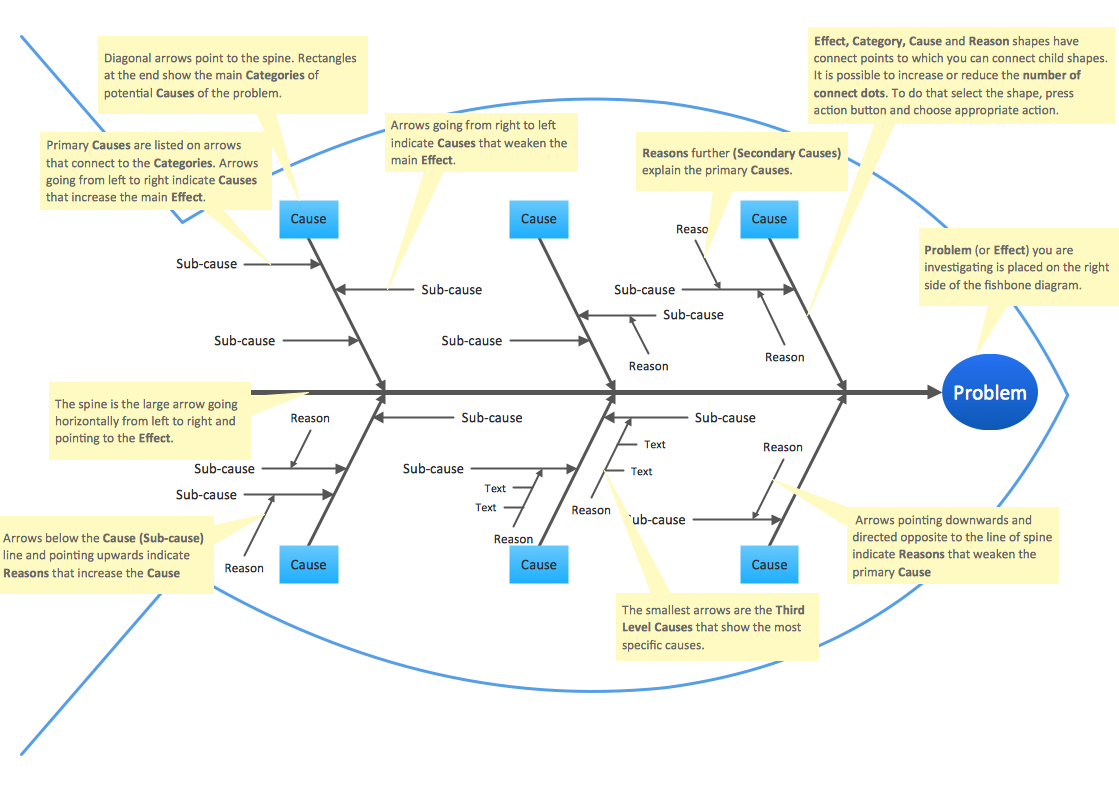
Fishbone Diagram Template
A causal model is an abstract concept, that describes the causal mechanisms of a system, by noting certain variables and their influence on each other, in an effort to discover the cause of a certain problem or flaw. This model is presented in diagram form by using a fishbone diagram. ConceptDraw DIAGRAM diagramming and vector drawing software enhanced with Fishbone Diagrams solution helps you create business productivity diagrams from Fishbone diagram templates and examples, that provide to start using of the graphic method for the analysis of problem causes. Each predesigned Fishbone Diagram template is ready to use and useful for instantly drawing your own Fishbone Diagram.
 Object-Role Modeling (ORM) Diagrams
Object-role Modeling (ORM) Diagram solution with powerful vector diagramming and data modeling tools, large quantity of specially developed samples and examples, and rich variety of vector objects corresponding to common ORM notation, ideally suits for developing the comprehensive, clear and visual Object-role Modeling (ORM) diagrams and schematics, understandable for all interested people from the different fields and business directions, for designing the ORM models, and demonstrating advantages from the use of ORM and its notation. It is intended for software developers and computer engineers, specialists in a field of Object-oriented programming (OOP), database architects, web-application constructors and developers, etc.
Best Flowchart Software and Flowchart Symbols
For many years ConceptDraw Solution Park delivers a great quantity of high-quality business process flowchart and flow diagram solutions, which are turned the ConceptDraw DIAGRAM into the most comprehensive and powerful software. Now it is an example of the best professional flowchart software available with extensive set of solutions, including the Flowcharts solution. The ConceptDraw solutions contain thousands of standard basic and creative flowchart symbols and other design elements, numerous quick-start templates, samples and examples. ConceptDraw DIAGRAM diagramming and vector graphics software includes specific drawing tools that you need to easily design the flowcharts and diagrams of any complexity and degree of detailing. Use ConceptDraw DIAGRAM to draw your own diagrams, charts, graphs and flowcharts for graphic communication, simple visual presentation of complex structures, numerical data and logical relations, explanation business and personal ideas and concepts, representation step-by-step flows of actions or operations, etc.
 Seven Basic Tools of Quality
Seven Basic Tools of Quality solution is useful for all ConceptDraw DIAGRAM users, giving them a particular set of different graphical techniques helping on focus on such activity as identifying the root cause of many quality-related issues. This solution offers the well-known visual tools helpful in representing all the data related to different quality initiatives. Some of such tools are the pre-made templates useful for making different fishbone diagrams, Pareto charts, and histograms. It is ideal for all who want to manage quality control throughout an organization by using a modern tool.
 Health Package
Health Package is a set of multifaceted solutions intended for visualization and illustration in a field of medicine and health, for drawing colorful, interesting and precise illustrations and infographics that will be used successfully in medical documents, articles, special magazines, posters, billboards, websites, presentations, collages. Having these solutions available, it will not be difficult to illustrate the medical editions, to convey the information in a full and interesting form, to teach students with use effective visual methods, to describe the medical facts, to tell about innovations in a field of medicine, health and correct nutrition, to explain the causes and consequences of different diseases, as well as the measures of their prevention and treatment.
Pyramid Diagram
The purchase or purchasing funnel is a consumer focused marketing model which illustrates the theoretical customer journey towards the purchase of a product or service.Cross-Functional Flowchart
Use of Cross-Functional Flowchart is a clear way of showing each team member’s responsibilities and how processes get shared or transferred between different responsible people, teams and departments. Use the best flowchart maker ConceptDraw DIAGRAM with a range of standardized cross-functional flowchart symbols to create the Cross-Functional Flowcharts simply and to visualize the relationship between a business process and the functional units responsible for that process. To draw the most quickly Cross-Functional Flowcharts, Cross Functional Process Maps, or Cross Functional Process Flow Diagrams, start with a Cross-functional flowchart samples and templates from ConceptDraw Solution Park. The ConceptDraw Arrows10 and RapidDraw technologies will be also useful for you in drawing. ConceptDraw DIAGRAM supports designing both types - horizontal and vertical Cross-functional flowcharts. A vertical layout makes the accents mainly on the functional units while a horizontal layout - on the process. If you need a Visio alternative in Mac OS X, try ConceptDraw DIAGRAM. Its interface is very intuitive and it’s actually much easier to use than Visio, yet somehow it’s just as powerful if not more so. ConceptDraw DIAGRAM performs professional quality work and seamless Visio interaction.
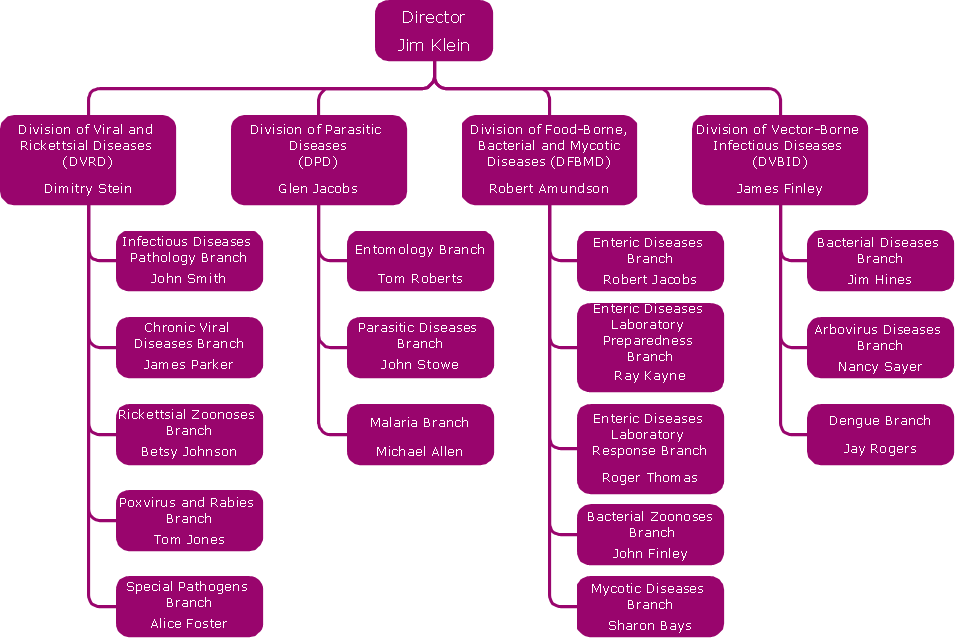
Business Structure
Each business is created, exists and develops according to its type of business structure. Creating new business or developing existing, you may need a powerful software for representing its business structure. In this case ConceptDraw DIAGRAM diagramming and vector drawing software extended with 25 Typical Orgcharts solution from the Management area is exactly what you need.
 Business Management Package
Business Management Package is a large set of graphical solutions from the ConceptDraw Solution Park. They are selected to help in solving the business, management, marketing and quality tasks in a best way. It is useful for many management specialists, marketing experts, business specialists, international business experts, IT managers, specialists in managing the business processes, financial specialists, and other business related specialists. Create documents, reports, statistical summaries, describe business processes, build business models for many fields including finance, education, logistic, landscape design, health, cooking, and many more.
 Process Flowcharts
This solution extends ConceptDraw DIAGRAM software with templates, samples, and library of vector shapes for drawing the Process Flowcharts.
Human Resource Management
ConceptDraw DIAGRAM diagramming and vector drawing software enhanced with powerful HR Flowcharts Solution from the Management Area of ConceptDraw Solution Park perfectly suits for Human Resource Management.How To Draw a Diagram
Is it possible to draw a diagram as quickly as the ideas come to you? The innovative ConceptDraw Arrows10 Technology included in ConceptDraw DIAGRAM is a simple and powerful tool to create any type of diagram. You mau choose to start from one of plenty diagram templates or to use your own idea.- Basic Flowchart Symbols and Meaning | Organizational Structure ...
- Design elements | Quality Control Name And Symbol Used
- Flow Chart Symbols | Inspection Chart Symbol Name And Function
- Probability Quality Control Tools | Process Flowchart | Identifying ...
- How To Create a FlowChart using ConceptDraw | Flow Chart Symbols
- Basic Flowchart Symbols and Meaning | Process Flowchart | Cross ...
- Process Flowchart | Engineering Symbols In Quality Department
- Process Flowchart | Quality Used Symbols
- Process Flowchart | Quality Department Used Symbols
- Basic Flowchart Symbols and Meaning | Process Flowchart | ERD ...


