Quality Engineering Diagrams
Create Quality Engineering Diagrams (value stream maps) - for value stream analysis and value stream management, material and information flow mapping, using our quick start templates included with ConceptDraw.Types of Flowchart - Overview
When designing a process or an instruction in clear and understandable way, you should consider creating a flowchart. You can avoid spending a lot of time understanding complex concepts as they get clear with different diagrams. The flowcharts are very popular diagram type, they are useful at different fields from the description business processes to the presentation of cooking recipes. Basic Flowchart, Business Process Modeling Diagram, Process Flowchart, Cross Functional Flowchart, Procedure Flowchart, Data Flow Diagram, IDEF Flowchart, SDL Diagram, Workflow Diagram, Document Flowchart, Program Flowchart, Value Stream Map, System Flowchart, Highlight Flowchart, Sales Flowchart are the main types flowchart. The ConceptDraw PRO is one of the professional applications which has great advantages and using which you can create different types of Flowcharts easy and fast. Try to draw an illustrative and comprehensible diagram in ConceptDraw PRO describing the processes instead of writing complex long text and make sure how it is convenient. Visio is expensive, and if you use it in a team environment, these costs are compounded. ConceptDraw PRO is an affordable alternative to Visio and luckily, it comes with a team plan. ConceptDraw PRO can import and export Visio files, so Mac users can collaborate with PC users stuck on Microsoft's software.
VSM
Value stream mapping is a lean-management method for analyzing the current state and designing a future state for the series of events that take a product or service from its beginning through to the customer. ConceptDraw PRO diagramming and vector drawing software extended with Value Stream Mapping solution from the Quality area of ConceptDraw Solution Park is effective for implementation a value stream mapping (VSM) process and for creating Value Stream Maps.Process Flowchart
The main reason of using Process Flowchart or PFD is to show relations between major parts of the system. Process Flowcharts are used in process engineering and chemical industry where there is a requirement of depicting relationships between major components only and not include minor parts. Process Flowcharts for single unit or multiple units differ in their structure and implementation. ConceptDraw PRO is Professional business process mapping software for making Process flowcharts, Process flow diagram, Workflow diagram, flowcharts and technical illustrations for business documents and also comprehensive visio for mac application. Easier define and document basic work and data flows, financial, production and quality management processes to increase efficiency of your business with ConcepDraw PRO. Business process mapping software with Flowchart Maker ConceptDraw PRO includes extensive drawing tools, rich examples and templates, process flowchart symbols and shape libraries, smart connectors that allow you create the flowcharts of complex processes, process flow diagrams, procedures and information exchange. Process Flowchart Solution is project management workflow tools which is part ConceptDraw Project marketing project management software. Drawing charts, diagrams, and network layouts has long been the monopoly of Microsoft Visio, making Mac users to struggle when needing such visio alternative like visio for mac, it requires only to view features, make a minor edit to, or print a diagram or chart. Thankfully to MS Visio alternative like ConceptDraw PRO software, this is cross-platform charting and business process management tool, now visio alternative for making sort of visio diagram is not a problem anymore however many people still name it business process visio tools.
 Total Quality Management TQM Diagrams
Total Quality Management Diagrams solution extends ConceptDraw PRO software with samples, templates and vector stencils library for drawing the TQM flowcharts.
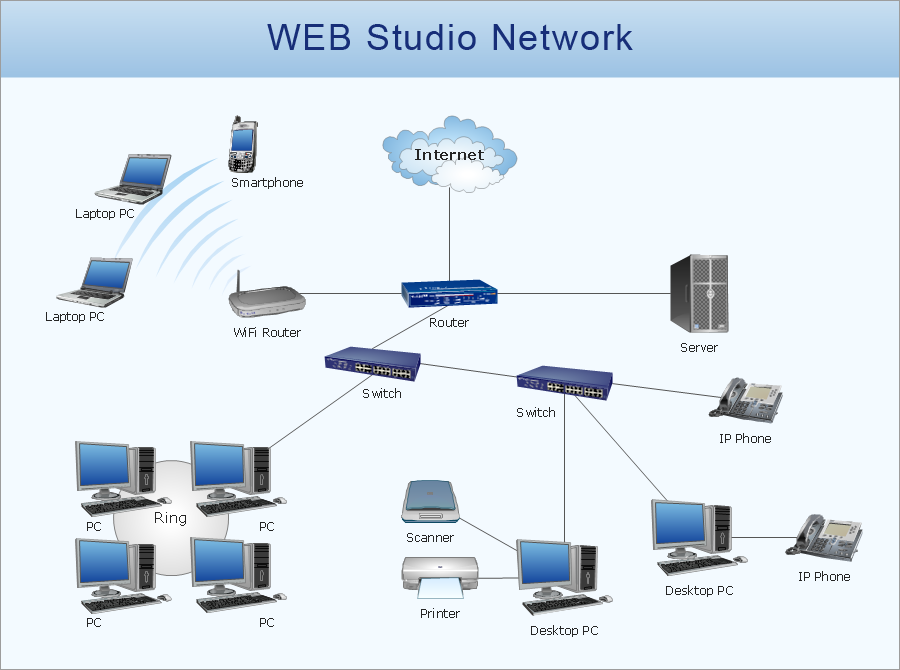
Network Diagram Software (PRO)
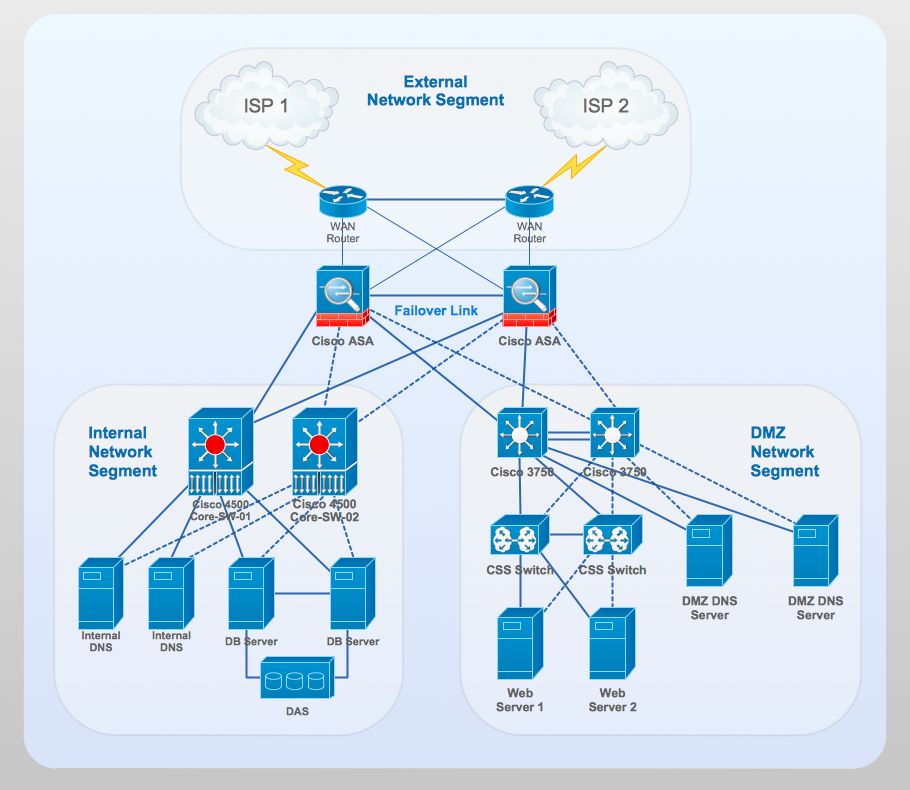
Network Diagrams are used to visually represent the network architecture, to illustrate the network structure, how the computers and other elements of the network are connected each other using a variety of network symbols, clipart and connection lines. They are incredibly useful on the stages of projecting computer network, of its construction and exploitation. Professionally designed and accurate Network Diagrams are equally convenient for computer engineers and users. You can construct them by hand on the paper or use special network diagramming software, such as ConceptDraw PRO. Having at disposal the powerful network diagramming tools of Computer Network Diagrams solution included to ConceptDraw Solution Park, you can succeed in drawing various types of Computer Network Diagrams, among them Network Communication Plans, Logical Network Diagrams, Network Topology Diagrams, LAN and WAN Diagrams, Network Floor Plan Layouts, Computer Network System Diagrams, Web-based Network Diagrams, Wireless Network Diagrams, Cisco Network Diagram, and others.
Block Diagram Creator
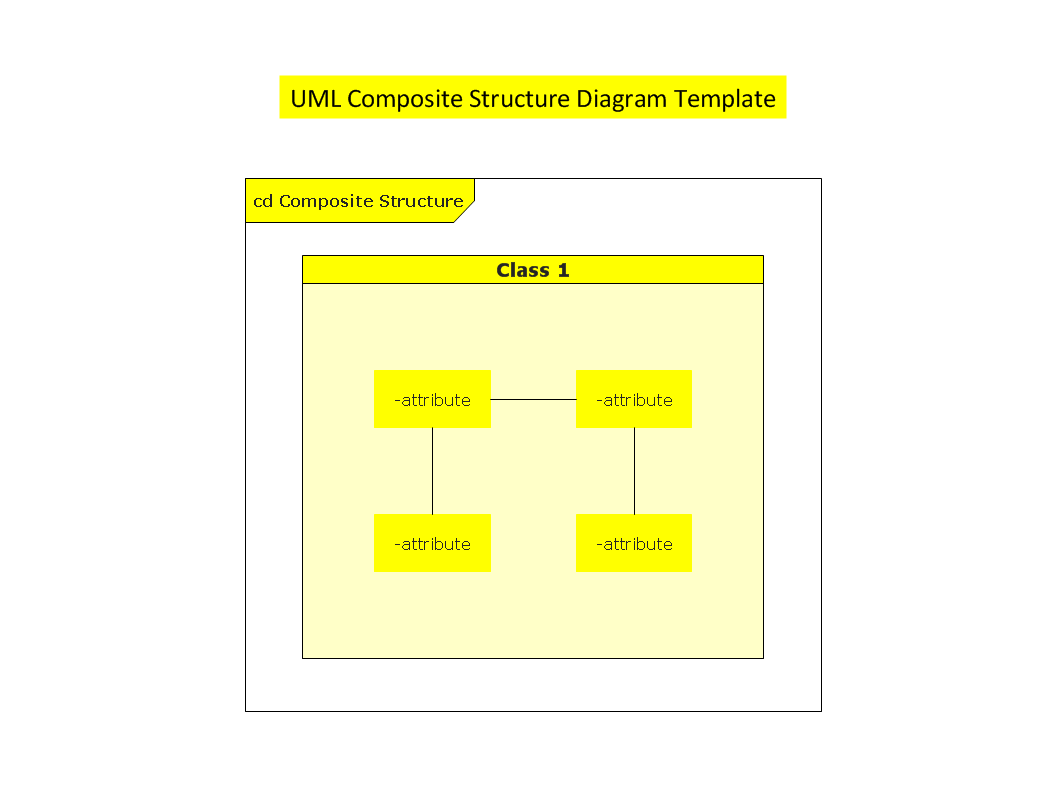
A block diagram is a diagram of a system in which the principal parts or functions are represented by blocks connected by lines that show the relationships of the blocks. ConceptDraw PRO diagramming and vector drawing software extended with Block Diagrams Solution from the "Diagrams" Area is a powerful Block Diagram Creator.UML Composite Structure Diagram
UML Composite Structure Diagram shows the internal structure of a class and the possible interactions at this structure.
 Quality Mind Map
This solution extends ConceptDraw MINDMAP software with Quality Management Mind Maps (Presentations, Meeting Agendas, Problem to be solved).
Network Gateway Router
Special libraries of highly detailed, accurate shapes and computer graphics, servers, hubs, switches, printers, mainframes, face plates, routers etc.
UML Use Case Diagrams
ConceptDraw has several examples that help you to start using software for designing UML Use Case Diagrams.
 ConceptDraw Solution Park
ConceptDraw Solution Park collects graphic extensions, examples and learning materials
 Seven Basic Tools of Quality
Manage quality control in the workplace, using fishbone diagrams, flowcharts, Pareto charts and histograms, provided by the Seven Basic Tools of Quality solution.
Swim Lane Diagrams
Swim Lane Diagrams are the kind of process flow diagrams and effective tool for documenting the business processes required for any business company for its productive work, for easy defining the weak points, reasons of defects, or delays during the process. Swim Lane Diagram is based on the IDEF3 standard and was developed primarily for using in projecting. Its name derives from the use of horizontal or vertical lanes. The blocks that denote the parts of the processes are arranged within definite lanes according to the belonging to responsible worker. So the process of any complexity is visually divided into the parts and represented with indication the responsibility for execution of each part. This significantly facilitates the comprehension of its work. Use the ConceptDraw PRO software and predesigned vector objects from the Swim Lanes library of Business Process Mapping Solution included to ConceptDraw Solution Park to easy develop Swim Lanes Flowcharts and Diagrams, for modeling and documenting the business processes in a simple and visual graphic form.- Quality Engineering Diagrams | Entity Relationship Diagram ...
- Value Stream Mapping | VSM | Quality Engineering Diagrams | Vsm ...
- Engineering Process Flow Value Map
- Process Flowchart | Quality Engineering Diagrams | ConceptDraw ...
- Value Stream Mapping | Quality Engineering Diagrams | VSM ...
- Quality Engineering Diagrams | Quality Mind Map | Engineering ...
- Entity Relationship Diagram Software Engineering | Quality ...
- Entity Relationship Diagram Software Engineering | Mechanical ...
- Building Drawing Design Element: Piping Plan | Quality Engineering ...
- Value Stream Mapping | Lean Manufacturing Diagrams | Quality ...
- Value Stream Mapping | Quality Engineering Diagrams | Value ...
- Process Flowchart | Types of Flowchart - Overview | Quality ...
- Process Flowchart | Quality Engineering Diagrams | Types of ...
- Process Flow Chart In Quality Engineer
- Quality Engineering Diagrams | Value Stream Diagram | What is ...
- Value Stream Mapping For Quality
- Lean Manufacturing Diagrams | Best Value Stream Mapping mac ...
- Block Diagram Of Quality Engineering
- Quality Engineering Diagrams
- Tree Diagram In Quality Engineering Management


