Line Chart Examples
The Line Graphs solution from Graphs and Charts area of ConceptDraw Solution Park contains a set of examples, templates and design elements library of line and scatter charts. Use it to draw line and scatter graphs using ConceptDraw PRO diagramming and vector drawing software for illustrating your documents, presentations and websites.
 Seven Basic Tools of Quality
Manage quality control in the workplace, using fishbone diagrams, flowcharts, Pareto charts and histograms, provided by the Seven Basic Tools of Quality solution.
Seven Basic Tools of Quality — Quality Control
ConceptDraw PRO diagramming and vector drawing software extended with Seven Basic Tools of Quality solution from the Quality area of ConceptDraw Solution Park provides effective tools for quality control and helps design any types of quality-related diagrams.Line Chart Templates
The Line Graphs solution from Graphs and Charts area of ConceptDraw Solution Park contains a set of examples, templates and design elements library of line and scatter charts. Use it to draw line and scatter graphs using ConceptDraw PRO diagramming and vector drawing software for illustrating your documents, presentations and websites.Line Chart Template for Word
This sample was created in ConceptDraw PRO diagramming and vector drawing software using the Line Graphs Solution from Graphs and Charts area of ConceptDraw Solution Park. This sample shows the Line Chart of annual percentage change. The Line Chart allows you to clearly see the changes of data over the time.
 Line Graphs
How to draw a Line Graph with ease? The Line Graphs solution extends the capabilities of ConceptDraw PRO v10 with professionally designed templates, samples, and a library of vector stencils for drawing perfect Line Graphs.
Chart Examples
Easy charting software comes with beautiful chart templates and examples. This makes it easy to create professional charts without prior experience.Scatter Chart Analysis. Scatter Chart Example
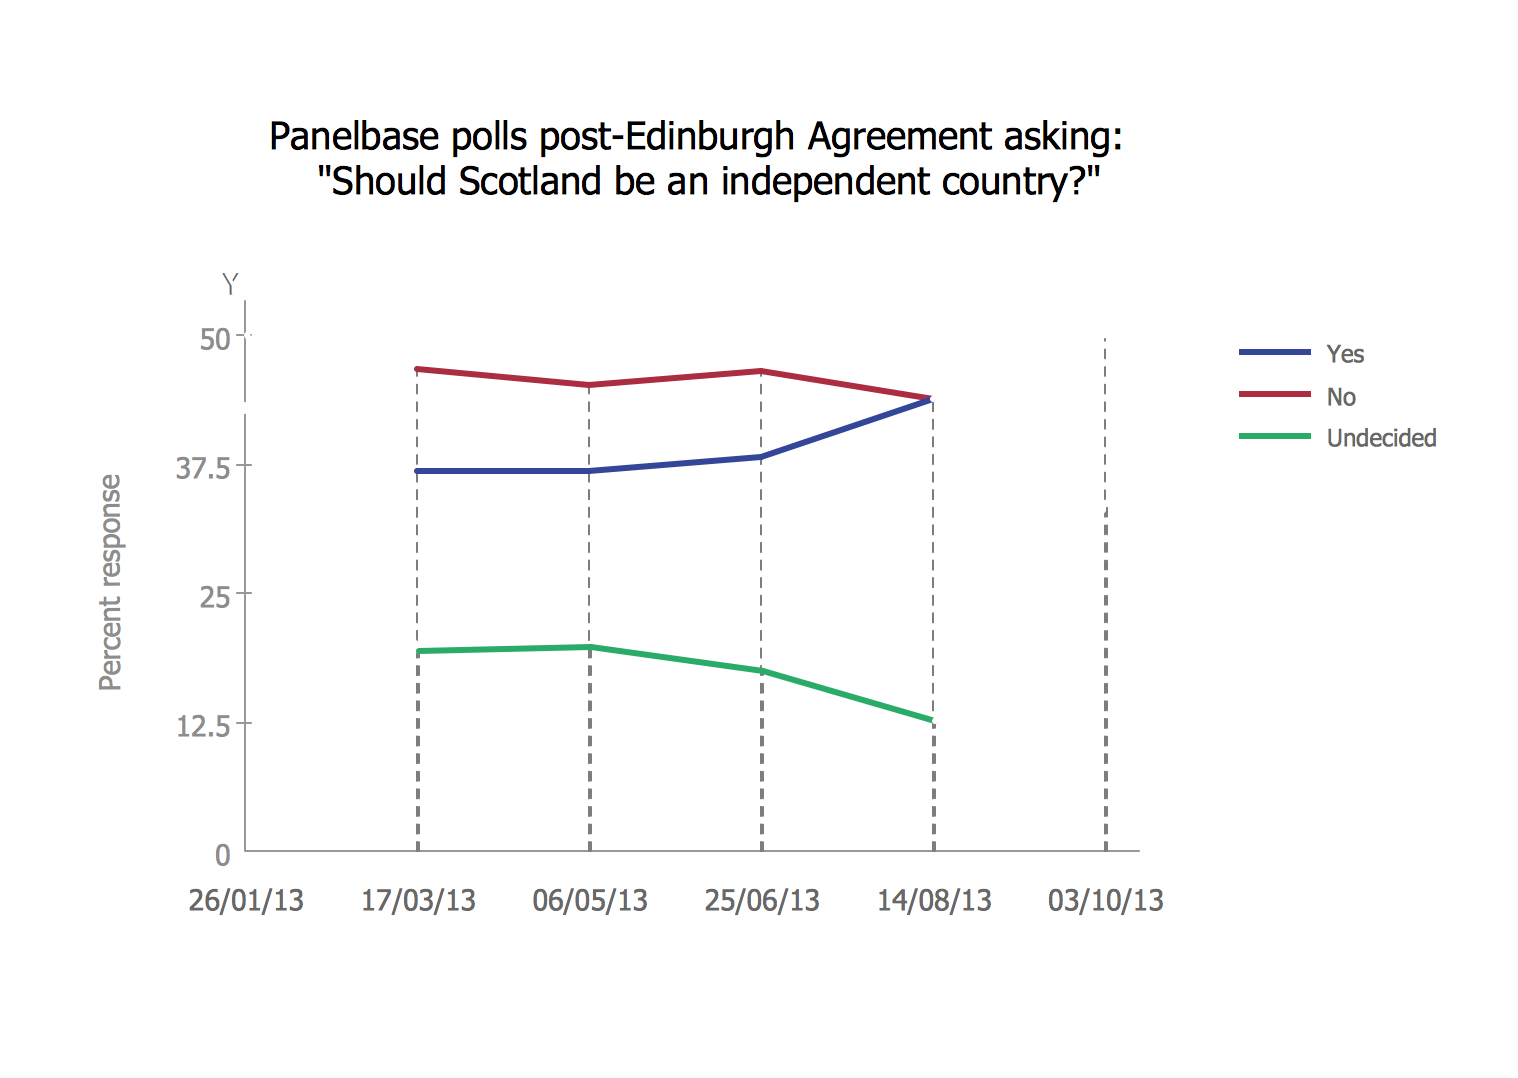
This sample shows the Scatter Chart that displays the polls on the referendum 2014 in Scotland. On this Scatter Chart the data are represented as points with two values of variables in the Cartesian coordinates. The points are connected by lines. This diagram can be useful in different opinion polls, referendums, for creating the reports.Pie Chart Word Template. Pie Chart Examples
The Pie Chart visualizes the data as the proportional parts of a whole and looks like a disk divided into sectors. The pie chart is type of graph, pie chart looks as circle devided into sectors. Pie Charts are widely used in the business, statistics, analytics, mass media. It’s very effective way of displaying relative sizes of parts, the proportion of the whole thing.
 Basic Line Graphs
This solution extends the capabilities of ConceptDraw PRO v10.3.0 (or later) with templates, samples and a library of vector stencils for drawing Line Graphs.
- Seven Basic Tools of Quality - Quality Control | Line Chart Examples ...
- Line Chart Examples | Seven Basic Tools of Quality | Design ...
- Basic Diagramming | Line Graph | Bar Graph | Scatter Plot On Us ...
- 2^x Function graph | Seven Basic Tools of Quality | Line Chart ...
- Pictures of Graphs | Line Graph | Line Chart Examples | Graph ...
- Line Chart Examples | Line Graph | Design elements - Stratification ...
- Basic Diagramming | Line Chart Examples | Pictures of Graphs ...
- Straight Line Program Flowchart
- Total Quality Management TQM Diagrams | Line Graphs | Basic Line ...
- Fishbone Diagrams | How Is A Timeline Graph Applied To Problem ...


