"Service quality is a comparison of expectations with performance.
A business with high service quality will meet customer needs whilst remaining economically competitive. Improved service quality may increase economic competitiveness.
This aim may be achieved by understanding and improving operational processes; identifying problems quickly and systematically; establishing valid and reliable service performance measures and measuring customer satisfaction and other performance outcomes." [Service quality. Wikipedia]
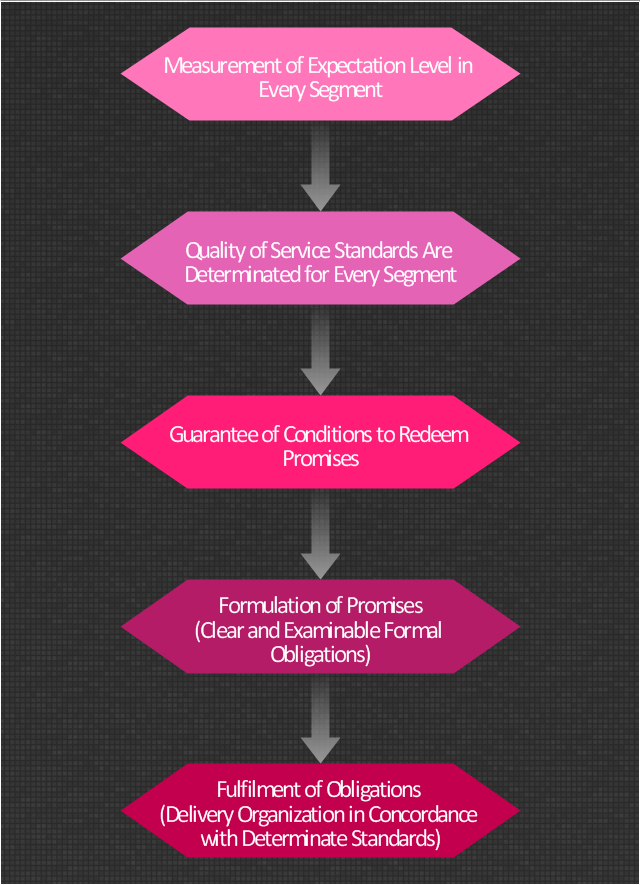
The block diagram example "Stages of promise issue" was created using the ConceptDraw PRO diagramming and vector drawing software extended with the Block Diagrams solution from the area "What is a Diagram" of ConceptDraw Solution Park.
 Block Diagrams
Block diagrams solution extends ConceptDraw PRO software with templates, samples and libraries of vector stencils for drawing the block diagrams.
 AWS Architecture Diagrams
The flexible AWS cloud solutions will help you to create reliable applications with a high level of scaling in the AWS cloud, to run your applications and accelerate their work on the level of security. Besides AWS resources are available worldwide and yo
 Fishbone Diagrams
The Fishbone Diagrams solution extends ConceptDraw PRO v10 software with the ability to easily draw the Fishbone Diagrams (Ishikawa Diagrams) to clearly see the cause and effect analysis and also problem solving. The vector graphic diagrams produced using this solution can be used in whitepapers, presentations, datasheets, posters, and published technical material.
 Fishbone Diagram
Fishbone Diagrams solution extends ConceptDraw PRO software with templates, samples and library of vector stencils for drawing the Ishikawa diagrams for cause and effect analysis.
 Safety and Security
Safety and security solution extends ConceptDraw PRO software with illustration samples, templates and vector stencils libraries with clip art of fire safety, access and security equipment.
 ConceptDraw Solution Park
ConceptDraw Solution Park collects graphic extensions, examples and learning materials
 Pyramid Diagrams
Pyramid Diagrams solution extends ConceptDraw PRO software with templates, samples and library of vector stencils for drawing the marketing pyramid diagrams.
 GHS Hazard Pictograms
GHS Hazard Pictograms solution contains the set of predesigned standard GHS pictograms, Hazardous symbols, and Hazard communication pictograms, approved and agreed by UN in Globally Harmonized System of Classification and Labelling of Chemicals (GHS). They can be used for quick and simple designing accurate and professional-looking infographics, diagrams, warning announcements, signboards, posters, precautionary declarations, regulatory documents, and for representing the main items of OSHA HAZCOM Standard.
 Food Court
Use the Food Court solution to create food art. Pictures of food can be designed using libraries of food images, fruit art and pictures of vegetables.
BPR Diagram. Business Process Reengineering Example
This sample was created in ConceptDraw PRO diagramming and vector drawing software using the Business Process Diagram Solution from the Business Processes area of ConceptDraw Solution Park. The Business Process Solution is based on the standard BPMN 2.0 and includes the set of libraries of ready-to-use objects.
 What are Infographic Area
Solutions of the area What is Infographics from ConceptDraw Solution Park collect templates, samples and vector stencils libraries with design elements for the drawing information graphics.
 Entity-Relationship Diagram (ERD)
Entity-Relationship Diagram (ERD) solution extends ConceptDraw PRO software with templates, samples and libraries of vector stencils from drawing the ER-diagrams by Chen's and crow’s foot notations.
 SWOT and TOWS Matrix Diagrams
SWOT and TOWS Matrix Diagrams solution extends ConceptDraw PRO and ConceptDraw MINDMAP software with features, templates, samples and libraries of vector stencils for drawing SWOT and TOWS analysis matrices and mind maps.
- Block Diagram Poster Mechanical Engineering
- Quality Poster Diagram
- Block diagram - Gap model of service quality | Process Flowchart ...
- Block diagram - Gap model of service quality | Taxi Service Data ...
- Block Diagram | Basic Diagramming | Create Block Diagram ...
- ER Diagram for Cloud Computing | Introduction to Cloud Computing ...
- Block diagram - Gap model of service quality | Block Diagrams ...
- Total Quality Management TQM Diagrams | Process Flowchart ...
- Process Flowchart | Block Diagrams | Block Diagram | Industry ...
- Quality In Manufacturing Block Diagram
- Block Diagram Technical Poster In Engineering
- Block diagram - Gap model of service quality | Cloud Computing ...
- Block diagram - Sources of customer satisfaction | Marketing ...
- Identifying Quality Management System | Definition TQM Diagram ...
- Block diagram - Document management system architecture | Block ...
- Production Management Block Diagram
- Manufacturing Block Diagrams
- Block Diagrams | Create Block Diagram | ConceptDraw Arrows10 ...
- Block Diagram For Production Management System

