 Rack Diagrams
Rack Diagrams solution extends ConceptDraw PRO software with samples, templates and libraries of vector stencils for drawing the computer network server rack mounting diagrams.
 macOS User Interface
macOS User Interface solution extends the ConceptDraw PRO functionality with powerful GUI software graphic design features and tools. It provides an extensive range of multifarious macOS Sierra user interface design examples, samples and templates, and wide variety of libraries, containing a lot of pre-designed vector objects of Mac Apps icons, buttons, dialogs, menu bars, indicators, pointers, controls, toolbars, menus, and other elements for fast and simple designing high standard user interfaces of any complexity for new macOS Sierra.
 Line Graphs
How to draw a Line Graph with ease? The Line Graphs solution extends the capabilities of ConceptDraw PRO v10 with professionally designed templates, samples, and a library of vector stencils for drawing perfect Line Graphs.
 Pie Charts
Pie Charts are extensively used in statistics and business for explaining data and work results, in mass media for comparison (i.e. to visualize the percentage for the parts of one total), and in many other fields. The Pie Charts solution for ConceptDraw PRO v10 offers powerful drawing tools, varied templates, samples, and a library of vector stencils for simple construction and design of Pie Charts, Donut Chart, and Pie Graph Worksheets.
 Business Intelligence Dashboard
Business Intelligence Dashboard solution extends the ConceptDraw PRO v11 functionality with exclusive tools, numerous ready-to-use vector objects, samples and quick-start templates for creation professional Business Intelligence Dashboards, Business Intelligence Graphics, Business Intelligence Charts and Maps of different kinds. Design easy the BI dashboard, BI model or Dynamic chart in ConceptDraw PRO to monitor the company's work, to track the indicators corresponding your company's data, to display and analyze key performance indicators, to evaluate the trends and regularities of the processes occurring at the company.
 Seven Basic Tools of Quality
Manage quality control in the workplace, using fishbone diagrams, flowcharts, Pareto charts and histograms, provided by the Seven Basic Tools of Quality solution.
Network Topology Mapper
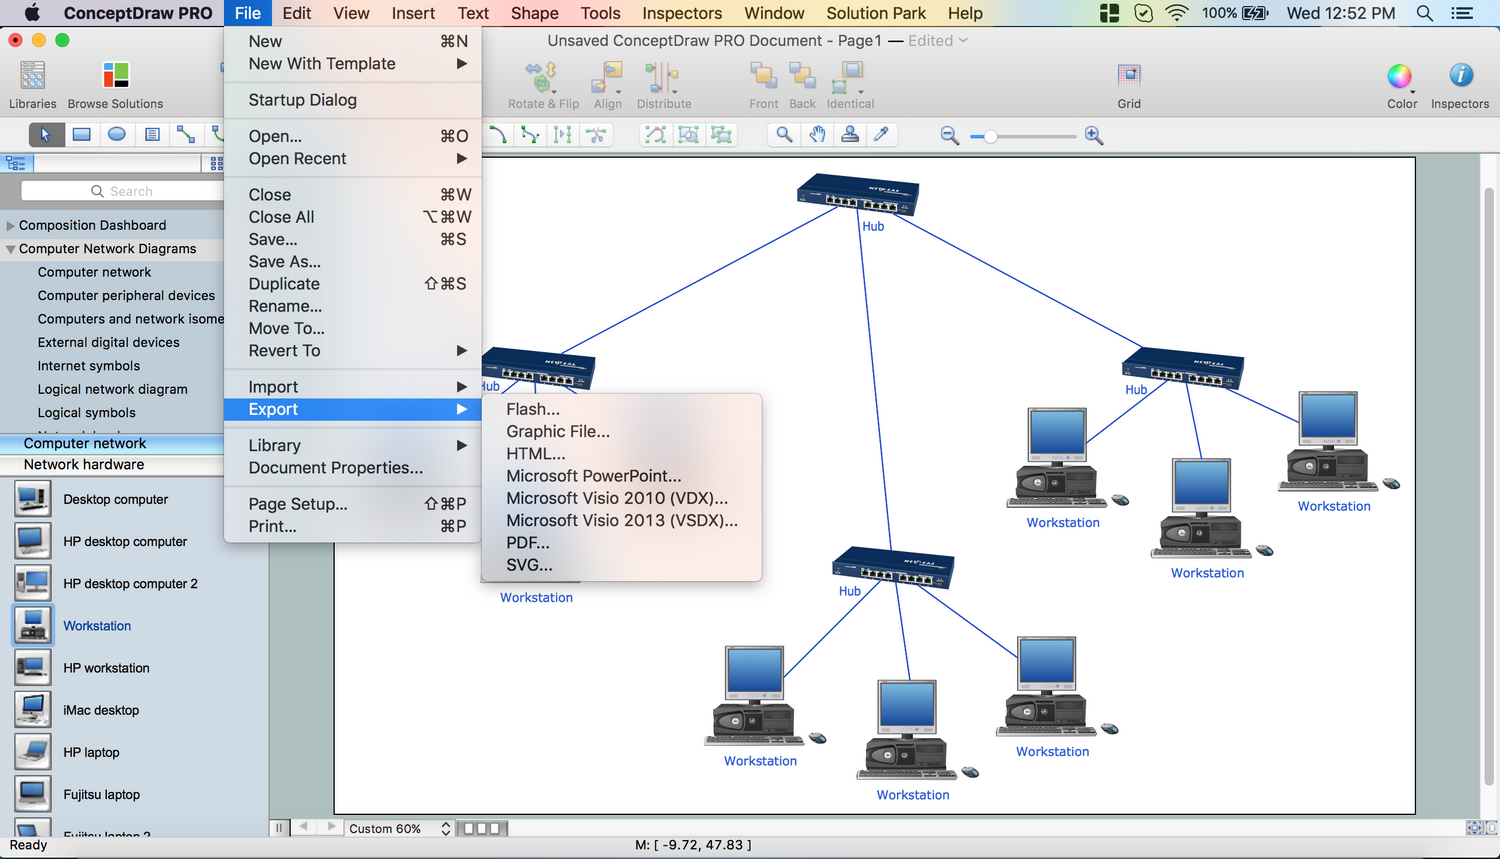
Network Topology in communication networks, a topology is a usually schematic description of the arrangement of a network, including its nodes and connecting lines. There are two ways of defining network geometry: the physical topology and the logical topology. Network Topology Mapper offers extensive drawing tools professional-looking network diagrams quickly and easily allowing you to clearly represent and communicate network architecture, topology, and design to engineers, stakeholders and end-users.- Rack diagrams - Vector stencils library | Rack Rate | Design Element ...
- Fire safety equipment - Vector stencils library | Rack diagrams ...
- Design elements - Rack diagram | Rack diagram - Template | Rack ...
- Rack diagrams - Vector stencils library | Network hardware - Vector ...
- Rack diagrams - Vector stencils library | Status indicators - Vector ...
- HVAC equipment - Vector stencils library | Food - Vector stencils ...
- Computer network - Vector stencils library | Education pictograms ...
- Optical Fiber Cable Clipart
- Trees and plants - Vector stencils library | Comtech - Vector stencils ...
- How To Make a Floor Plan | Design elements - Bedroom | Furniture ...
- Design elements - Bedroom | Furniture - Vector stencils library ...
- Furniture - Vector stencils library | Office furniture - Vector stencils ...
- Design elements - Cabinets and bookcases | Home Design ...
- Office furniture - Vector stencils library | Furniture - Vector stencils ...
- Design elements - Cabinets and bookcases | Cabinets and ...
- Design elements - Office furniture | Building Drawing Software for ...
- Vector Shapes Of Furniture For House Plans
- Sofas and chairs - Vector stencils library | Office furniture - Vector ...
- Plumbing and Piping Plans | How To use House Electrical Plan ...
- Interior Design Office Layout Plan Design Element | Office Layout ...
