Radar Chart
This sample shows the Radar Chart that compares the internet dimensions in the four countries. The Radar Chart represents the multivariate data as a two-dimensional chart with three or more variables displayed on the axes that start in one point. The Radar Charts are used in the quality management, business, analytics and sport.Percentage Spider Chart
ConceptDraw PRO creates drawings, diagrams and charts with great visual appeal in Mac OS X. This sample shows the Spider Chart that represents the buyer perceptions of the leather footwear industries in Brazil, India and Italy.Spider Chart
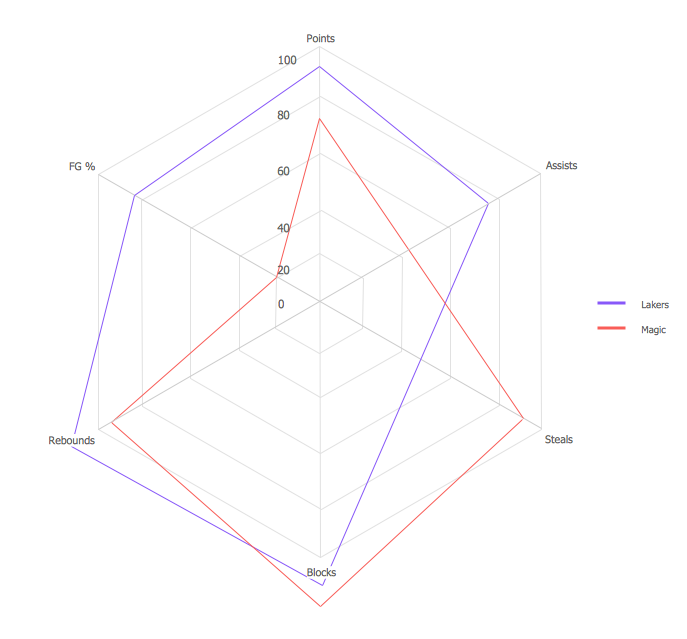
This sample shows the Spider Chart that represents the results of the team competitions and allows to compare them. The Spider Chart represents the multivariate data as a two-dimensional chart with three or more variables displayed on the axes that start in one point. The Spider Charts are widely used in the sport to show the strengths and weaknesses of the players.Spider Chart Template
This sample shows the Spider Chart that represents the budget and spending for one organization and allows to compare them. The multivariate data are represented on the Spider Chart as a two-dimensional chart with four or more variables displayed on the axes that start in one point. The Spider Charts are used in the management, business and sport.Examples Flowchart
ConceptDraw DIAGRAM diagramming and vector drawing software provides the unique Flowcharts Solution from the "Diagrams" Area of ConceptDraw Solution Park with variety of vector objects libraries and collection of examples Flowchart. Each example flowchart included in Flowcharts solution is a real help in drawing process, it can be the good base or perfect source of inspiration.
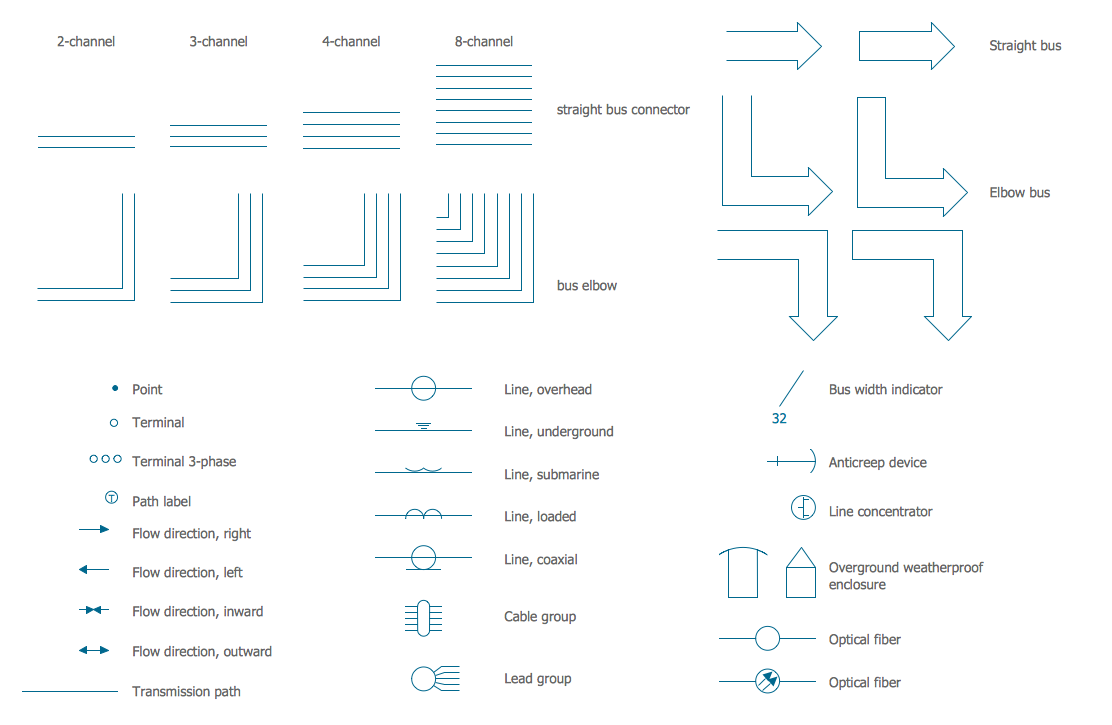
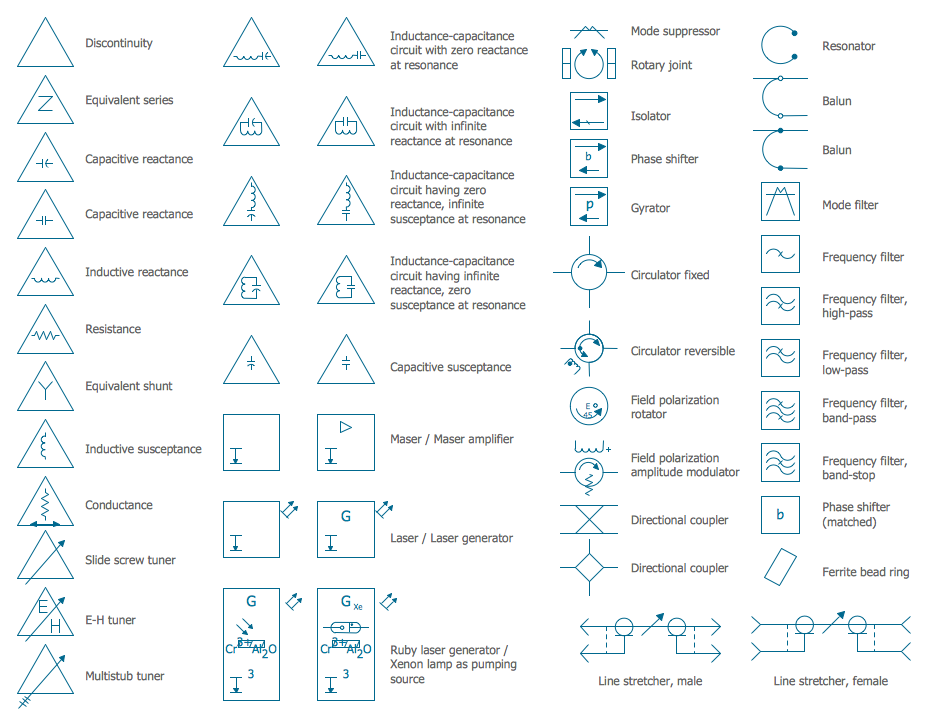
Electrical Symbols — Transmission Paths
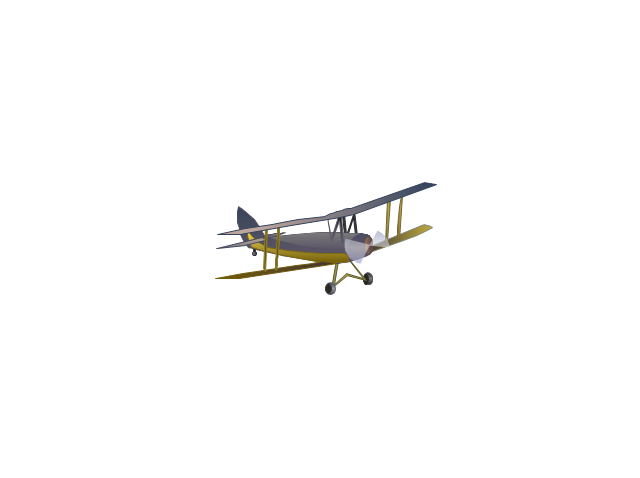
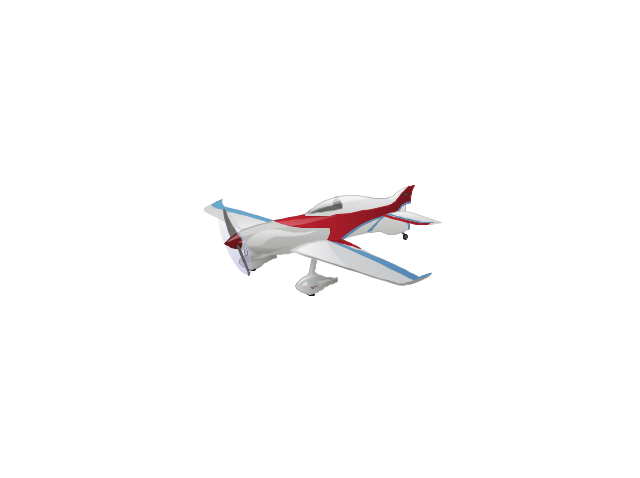
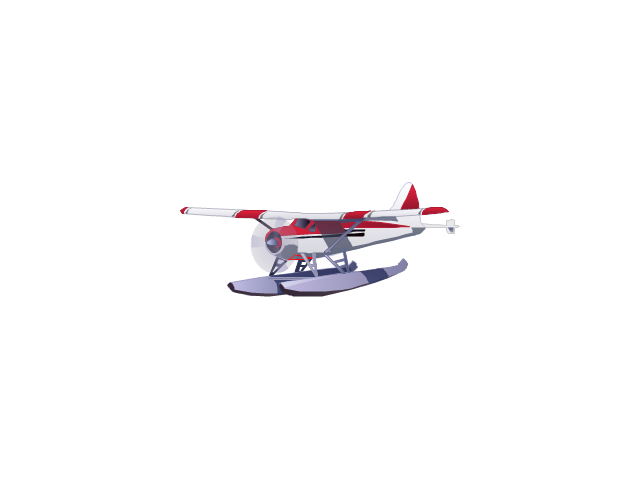
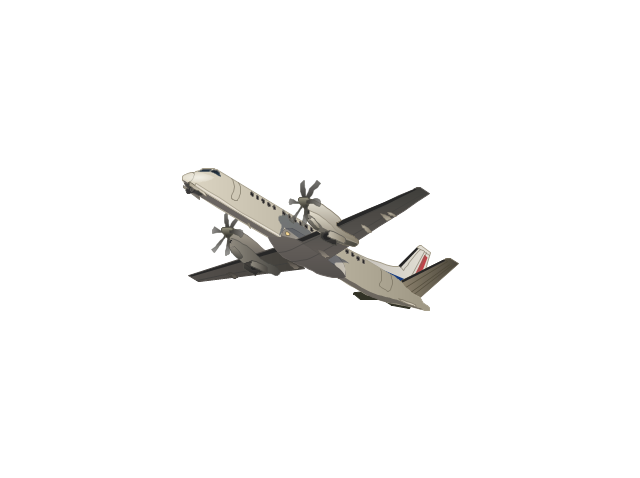
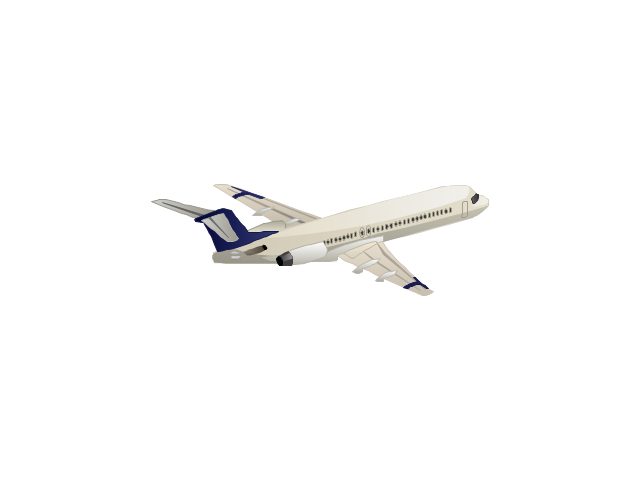
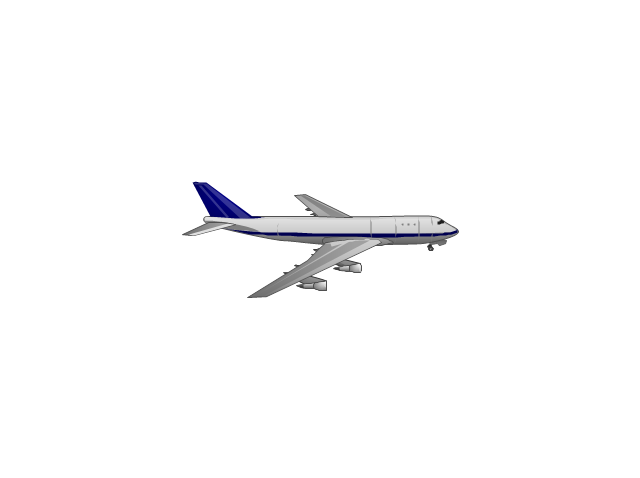
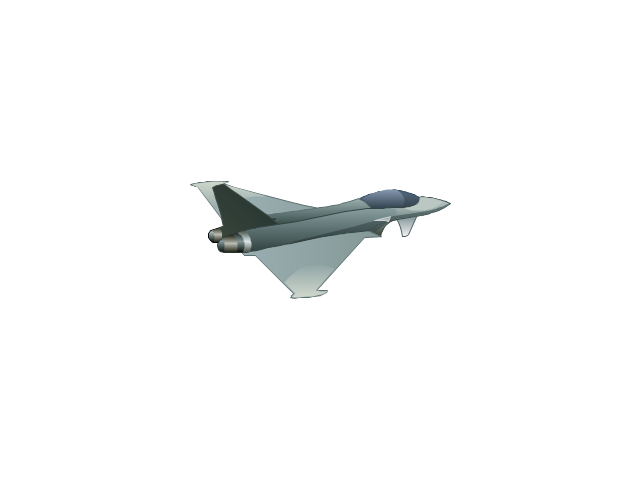
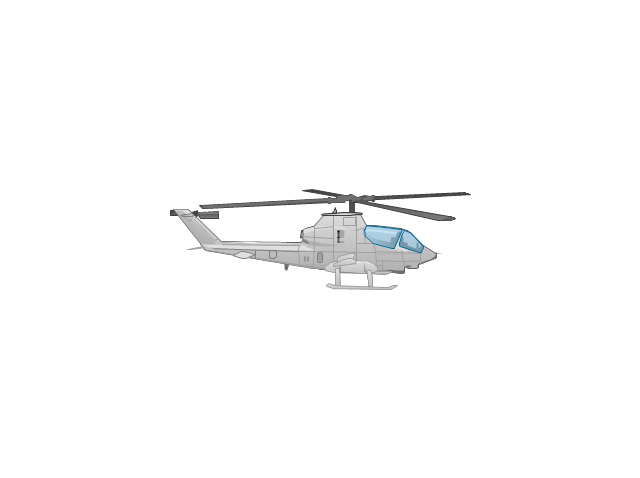
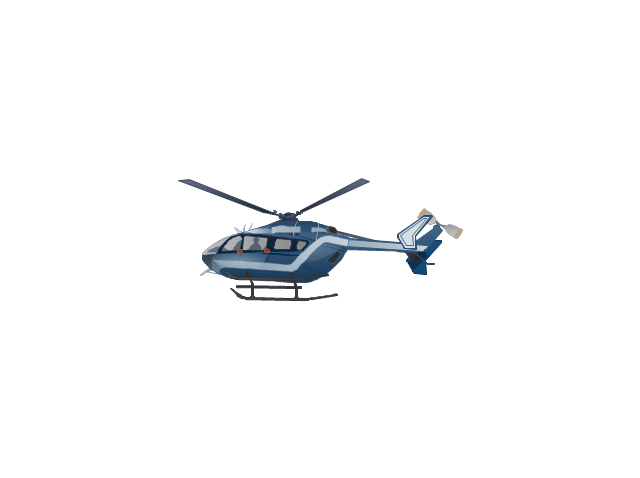
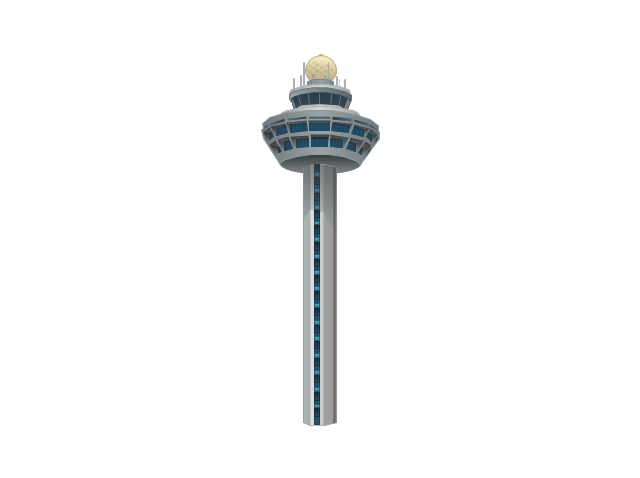
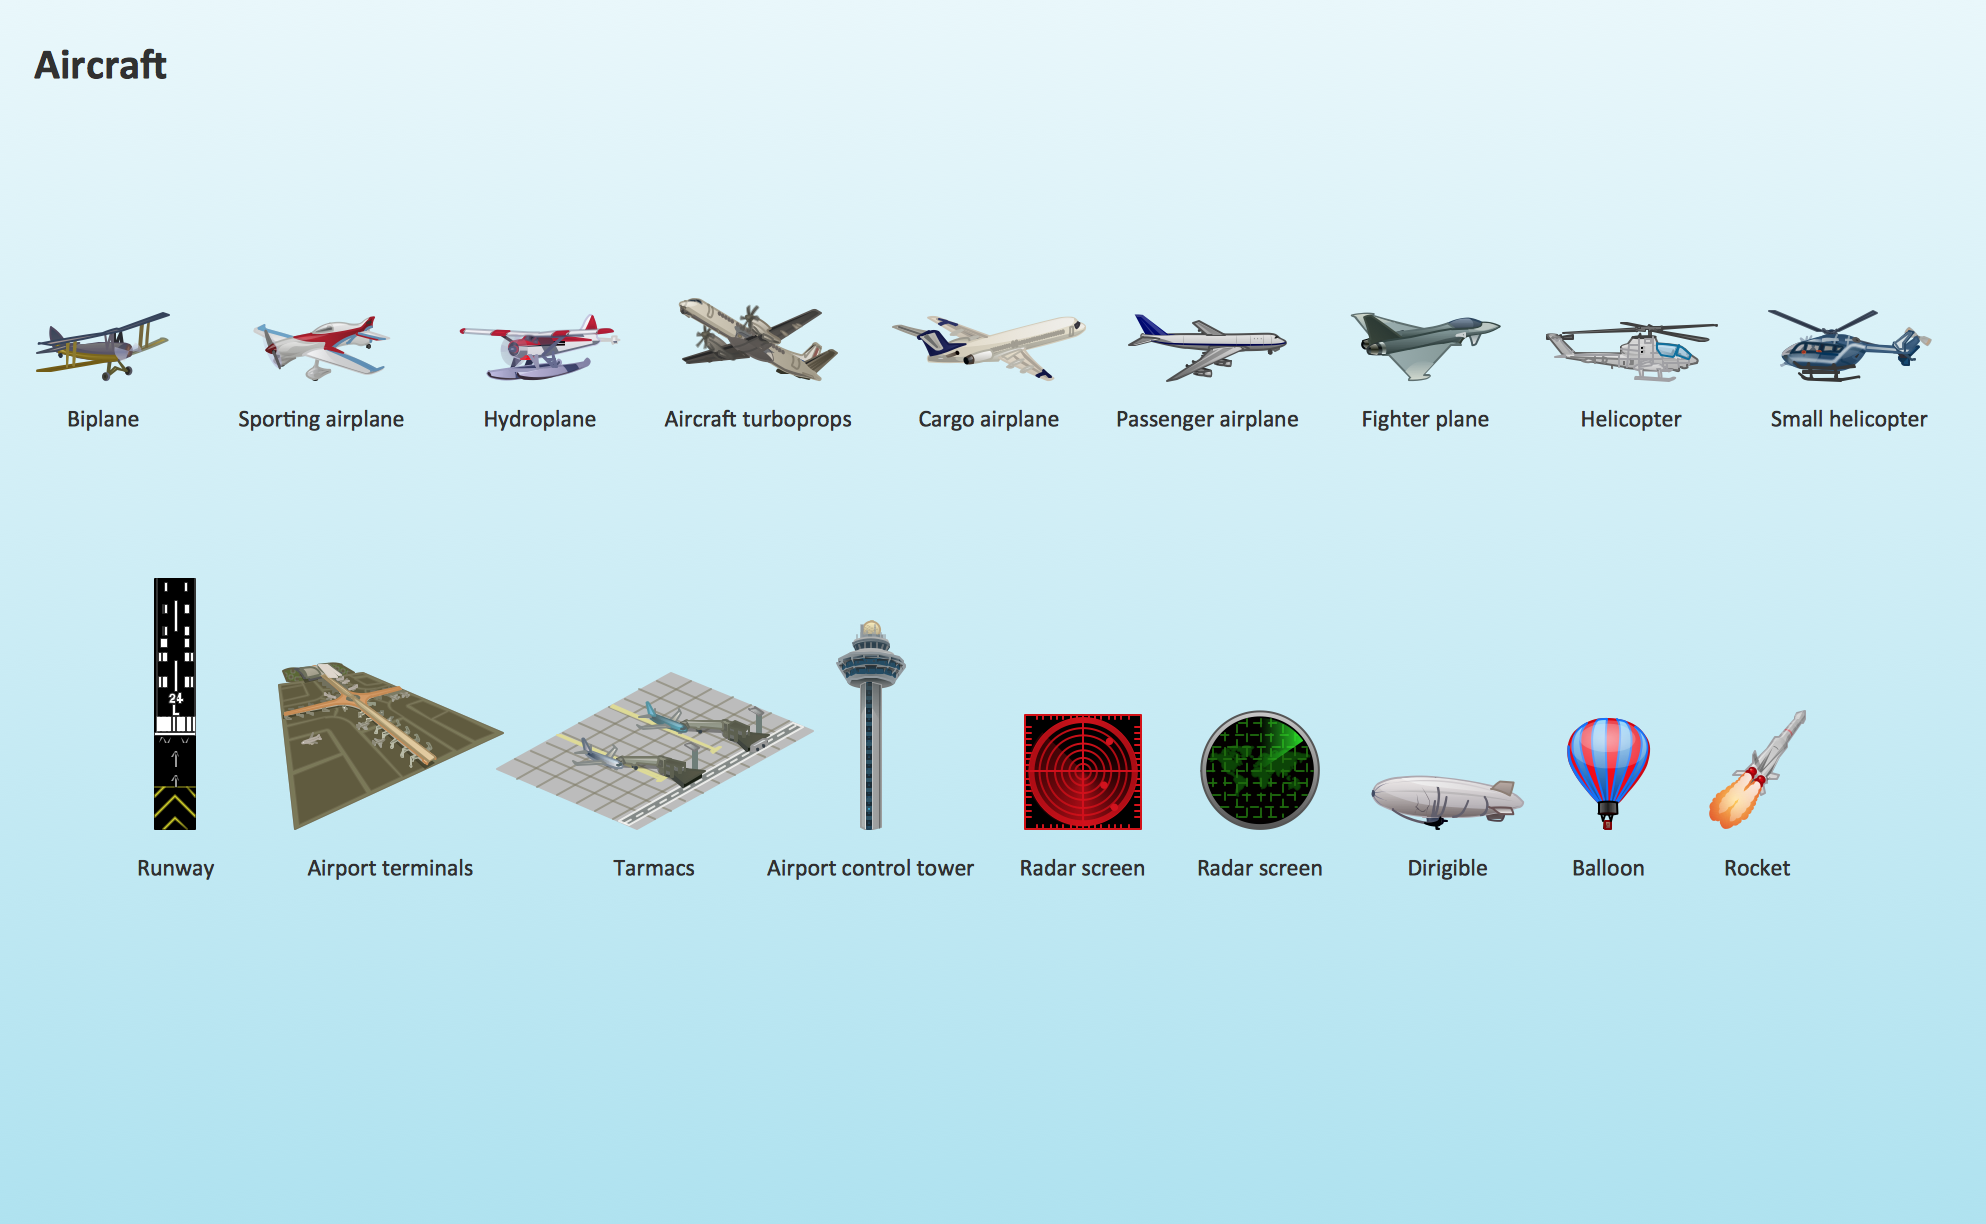
Variable delay elements are often used to manipulate the rising or falling edges of the clock or any other signal in integrated circuits. Delay elements are also used in delay locked loops and in defining a time reference for the movement of data within those systems. 26 libraries of the Electrical Engineering Solution of ConceptDraw DIAGRAM make your electrical diagramming simple, efficient, and effective. You can simply and quickly drop the ready-to-use objects from libraries into your document to create the electrical diagram.The vector stencils library "Aircraft" contains 19 clip art images for creating aviation illustrations, presentation slides, infographics and webpages using the ConceptDraw PRO diagramming and vector drawing software.
"An aircraft is a machine that is able to fly by gaining support from the air, or, in general, the atmosphere of a planet. It counters the force of gravity by using either static lift or by using the dynamic lift of an airfoil, or in a few cases the downward thrust from jet engines.
The human activity that surrounds aircraft is called aviation. Crewed aircraft are flown by an onboard pilot, but unmanned aerial vehicles may be remotely controlled or self-controlled by onboard computers. Aircraft may be classified by different criteria, such as lift type, propulsion, usage and others." [Aircraft. Wikipedia]
The vector stencils library "Aircraft" is included in the Aerospace and Transport solution from the Illustrations area of ConceptDraw Solution Park.
www.conceptdraw.com/ solution-park/ illustrations-aerospace-transport
 PM Dashboards
The PM Dashboards solution extends the management boundaries of ConceptDraw DIAGRAM and ConceptDraw PROJECT products with an ability to demonstrate changes to the budget status, to show the project progress toward its objectives, to display clearly the identified key performance indicator (KPI) or the set of key performance indicators for any project. This solution provides you with examples and ability to generate three types of visual dashboards reports based on your project data Project Dashboard, Tactical Dashboard, and Radar Chart. By dynamically charting the project’s key performance indicators that are collected on one ConceptDraw DIAGRAM document page, all project participants, project managers, team members, team leaders, stakeholders, and the entire organizations, for which this solution is intended, have access to the daily status of projects they are involved in.
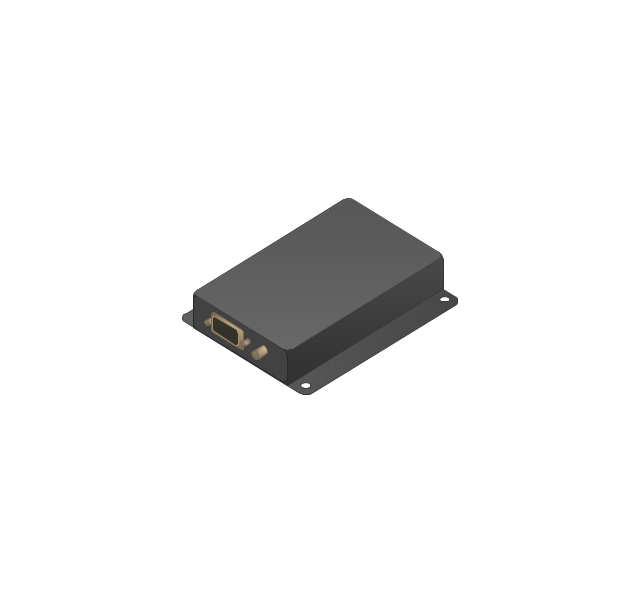
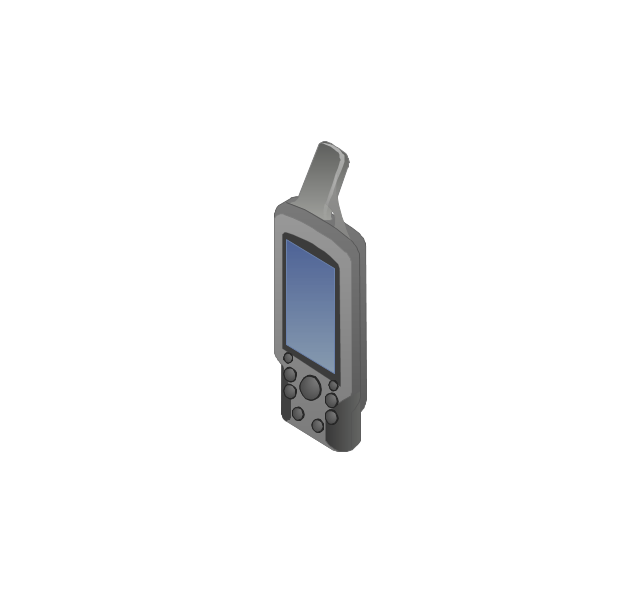
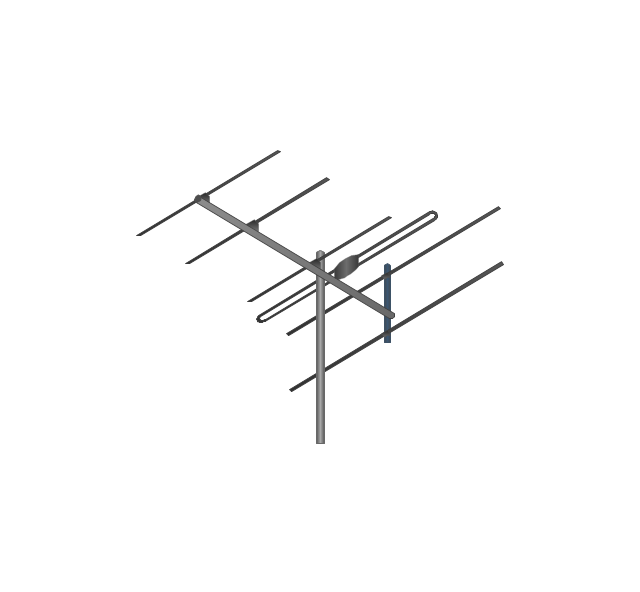
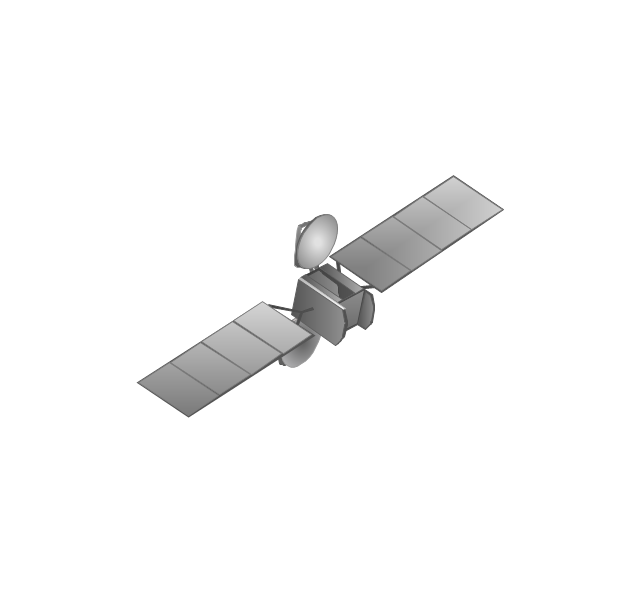
Electrical Symbols — VHF UHF SHF
Ultra high frequency (UHF) is the ITU designation for radio frequencies in the range between 300 MHz and 3 GHz, also known as the decimetre band as the wavelengths range from one meter to one decimetre. Radio waves with frequencies above the UHF band fall into the SHF (super-high frequency) or microwave frequency range. Lower frequency signals fall into the VHF (very high frequency) or lower bands. UHF radio waves propagate mainly by line of sight; they are blocked by hills and large buildings although the transmission through building walls is strong enough for indoor reception. They are used for television broadcasting, cell phones, satellite communication including GPS, personal radio services including Wi-Fi and Bluetooth, walkie-talkies, cordless phones, and numerous other applications. 26 libraries of the Electrical Engineering Solution of ConceptDraw DIAGRAM make your electrical diagramming simple, efficient, and effective. You can simply and quickly drop the ready-to-use objects from libraries into your document to create the electrical diagram.The vector stencils library "Aircraft" contains 19 clip art images for creating aviation illustrations, presentation slides, infographics and webpages using the ConceptDraw PRO diagramming and vector drawing software.
"An aircraft is a machine that is able to fly by gaining support from the air, or, in general, the atmosphere of a planet. It counters the force of gravity by using either static lift or by using the dynamic lift of an airfoil, or in a few cases the downward thrust from jet engines.
The human activity that surrounds aircraft is called aviation. Crewed aircraft are flown by an onboard pilot, but unmanned aerial vehicles may be remotely controlled or self-controlled by onboard computers. Aircraft may be classified by different criteria, such as lift type, propulsion, usage and others." [Aircraft. Wikipedia]
The vector stencils library "Aircraft" is included in the Aerospace and Transport solution from the Illustrations area of ConceptDraw Solution Park.
www.conceptdraw.com/ solution-park/ illustrations-aerospace-transport
How to Draw an Effective Flowchart
Use ConceptDraw DIAGRAM diagramming and business graphics software to draw your own flowcharts of business processes.Food Pictures
One of the key roles at the attracting visitors in catering establishments of different formats plays their visual solution, design of advertising elements of fast foods and restaurants. ConceptDraw DIAGRAM software enhanced with unique Food Court solution from the Food and Beverage area of ConceptDraw Solution Park allows to design inviting and attractive signboards, pictorial menus with appetizing food pictures.
 Telecommunication Network Diagrams
Telecommunication Network Diagrams solution extends ConceptDraw DIAGRAM software with samples, templates, and great collection of vector stencils to help the specialists in a field of networks and telecommunications, as well as other users to create Computer systems networking and Telecommunication network diagrams for various fields, to organize the work of call centers, to design the GPRS networks and GPS navigational systems, mobile, satellite and hybrid communication networks, to construct the mobile TV networks and wireless broadband networks.
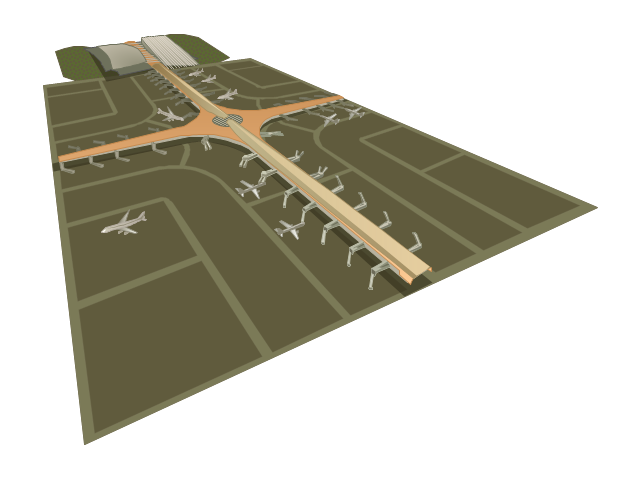
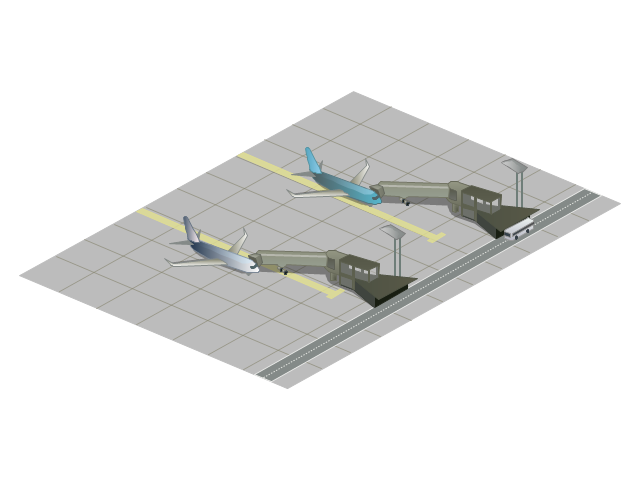
Aircraft - Design Elements
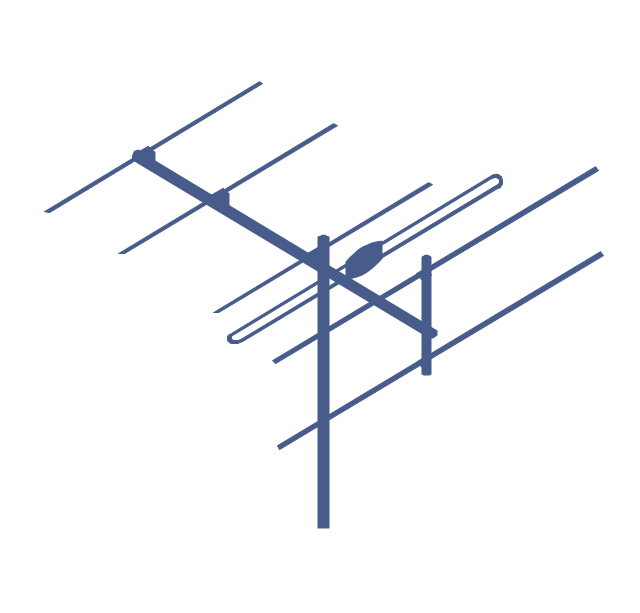
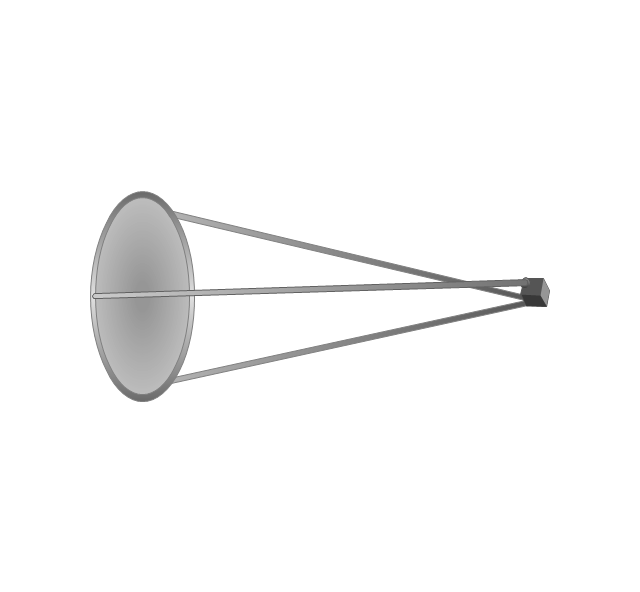
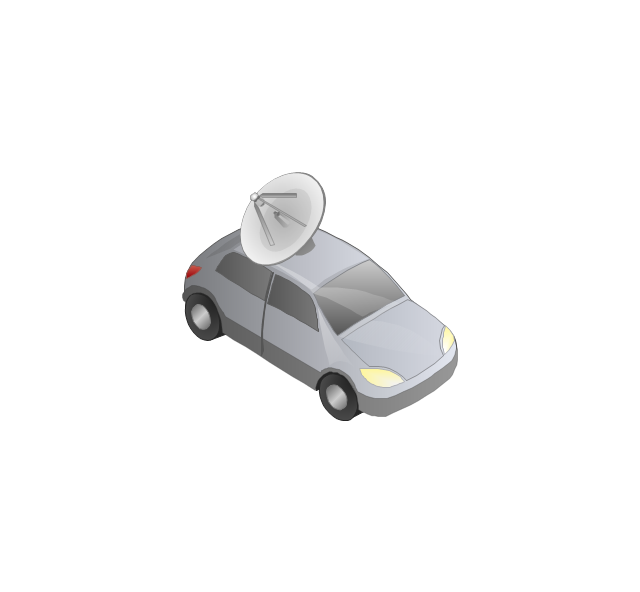
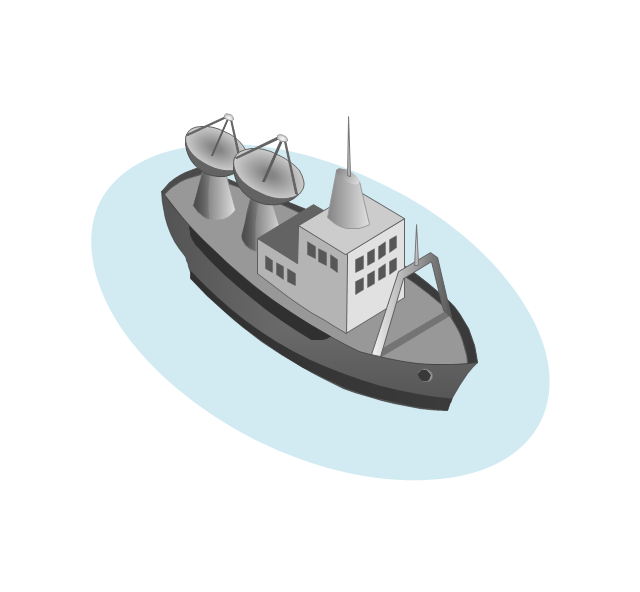
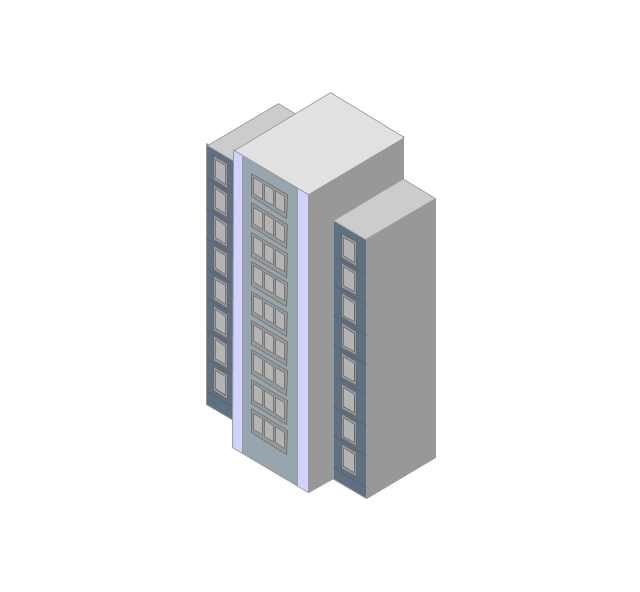
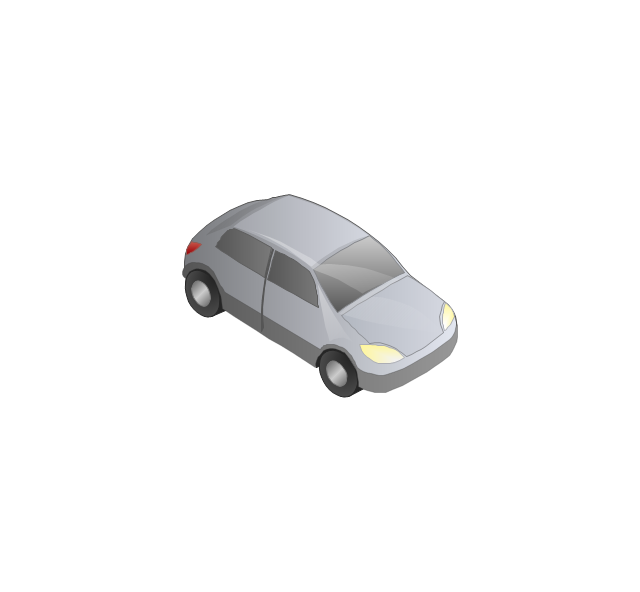
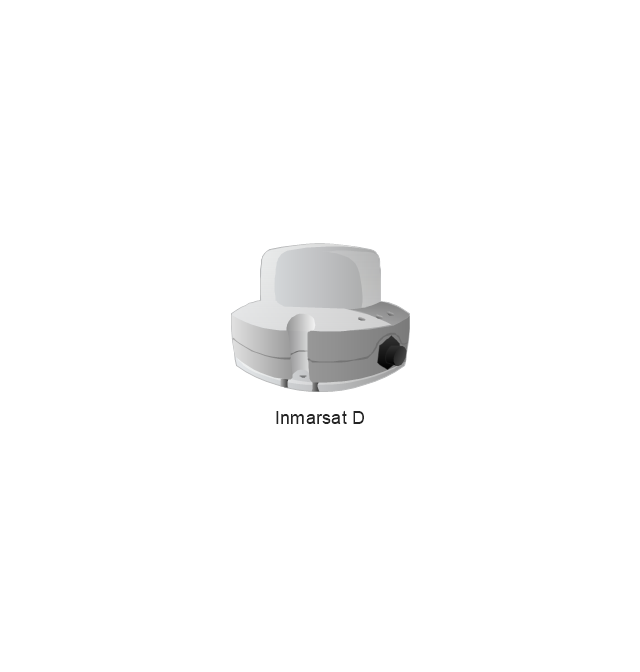
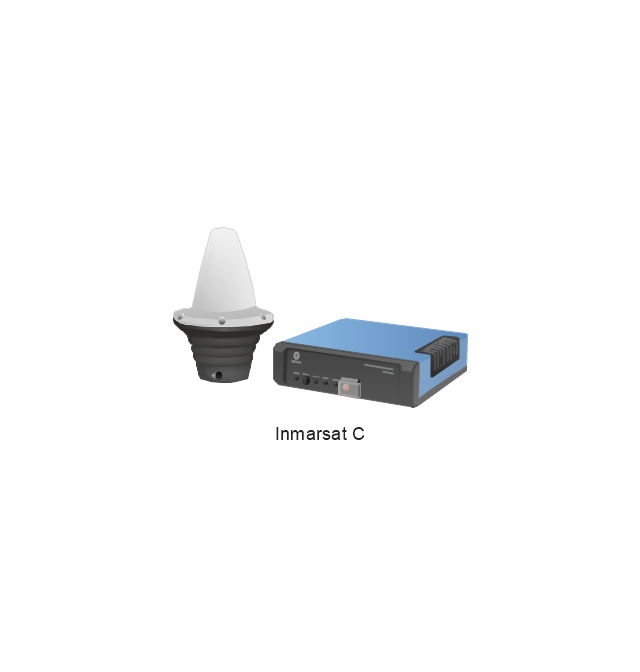
The vector stencils library Aircraft contains clipart of aerospace objects, transportation vehicles, office buildings, and ancillary facilities for ConceptDraw DIAGRAM diagramming and vector drawing software.The vector stencils library "Telecommunication networks" contains 32 clipart images of telecommunication network devices and equipment for drawing telecom network diagrams.
"A telecommunications network is a collection of terminal nodes, links and any intermediate nodes which are connected so as to enable telecommunication between the terminals.
The transmission links connect the nodes together. The nodes use circuit switching, message switching or packet switching to pass the signal through the correct links and nodes to reach the correct destination terminal.
Each terminal in the network usually has a unique address so messages or connections can be routed to the correct recipients. The collection of addresses in the network is called the address space." [Telecommunications network. Wikipedia]
The clip art example "Telecommunication networks - Vector stencils library" was created using the ConceptDraw PRO diagramming and vector drawing software extended with the Telecommunication Network Diagrams solution from the Computer and Networks area of ConceptDraw Solution Park.
Percentage Pie Chart. Pie Chart Examples
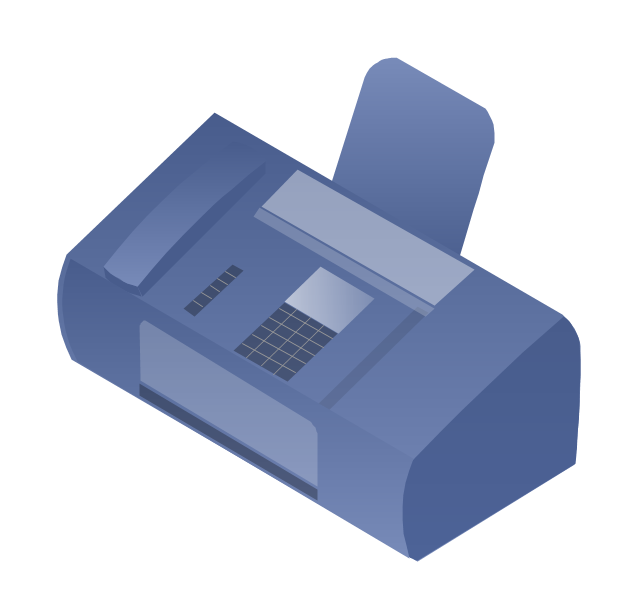
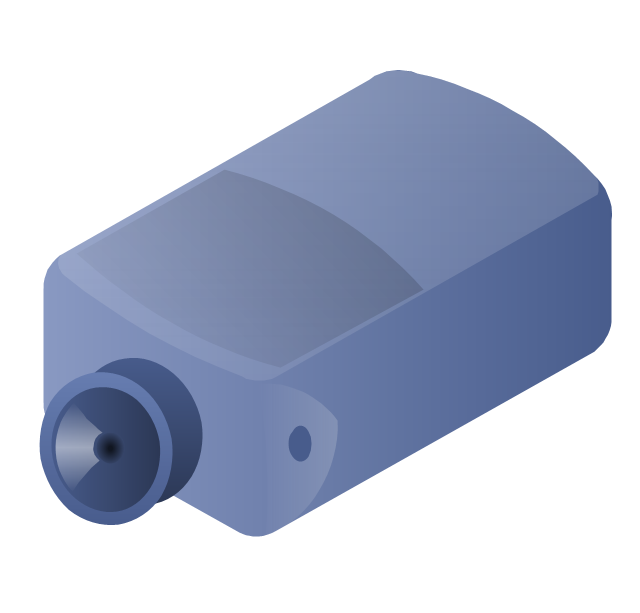
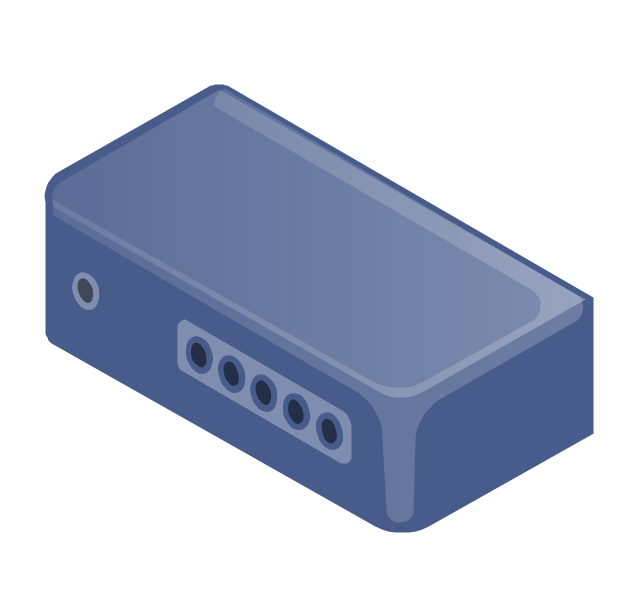
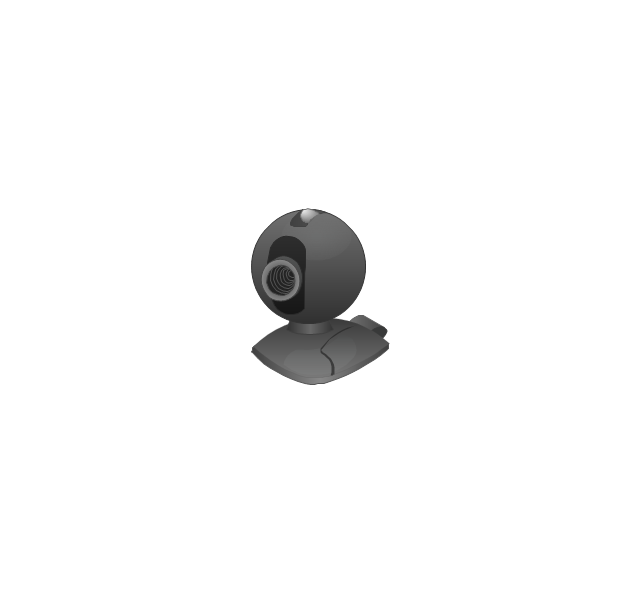
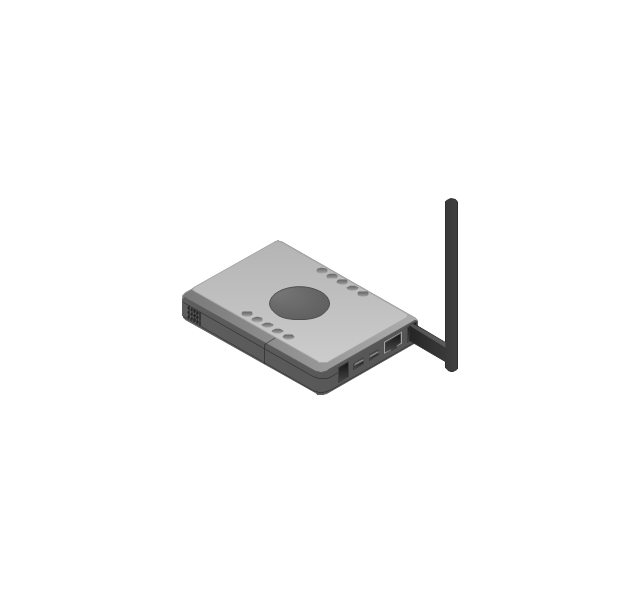
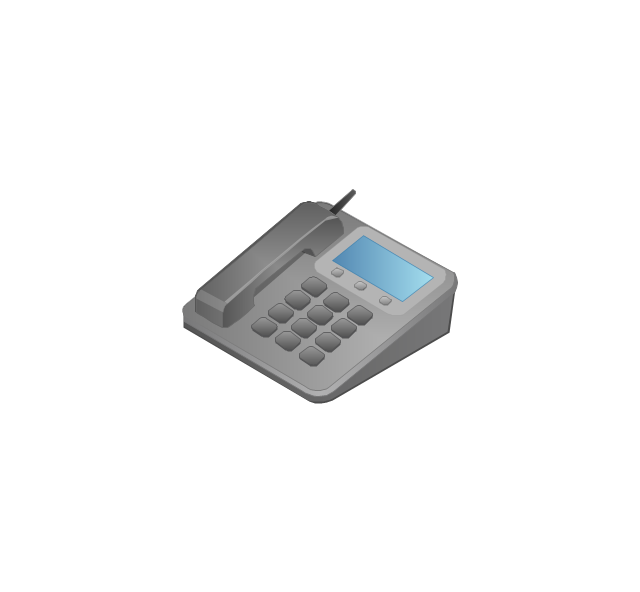
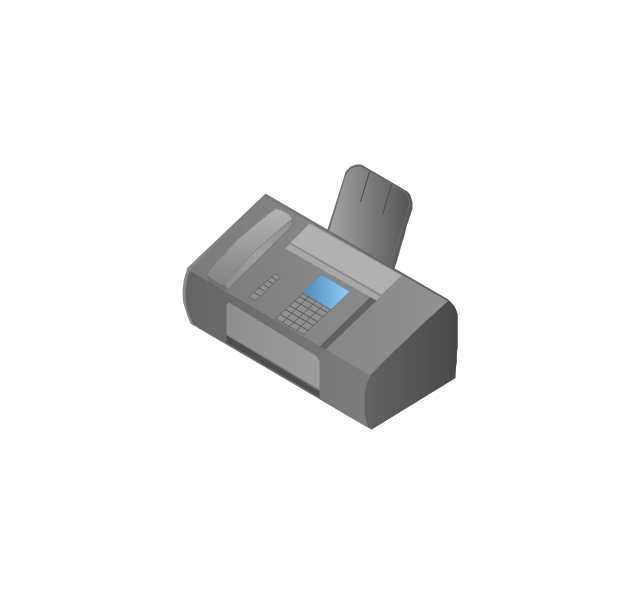
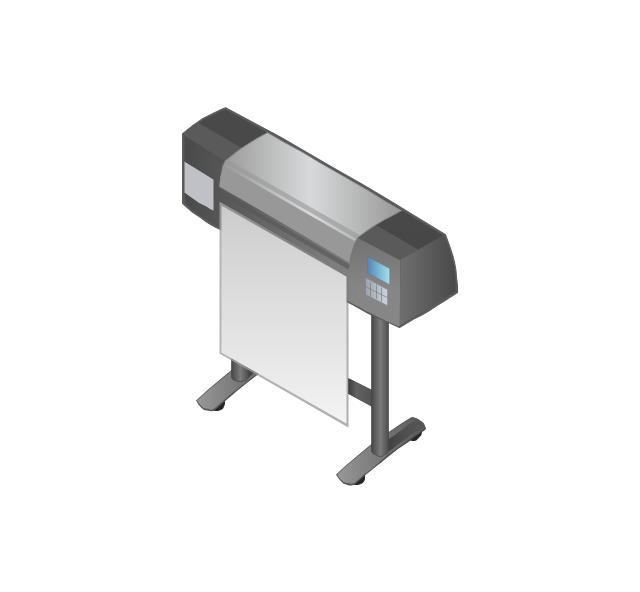
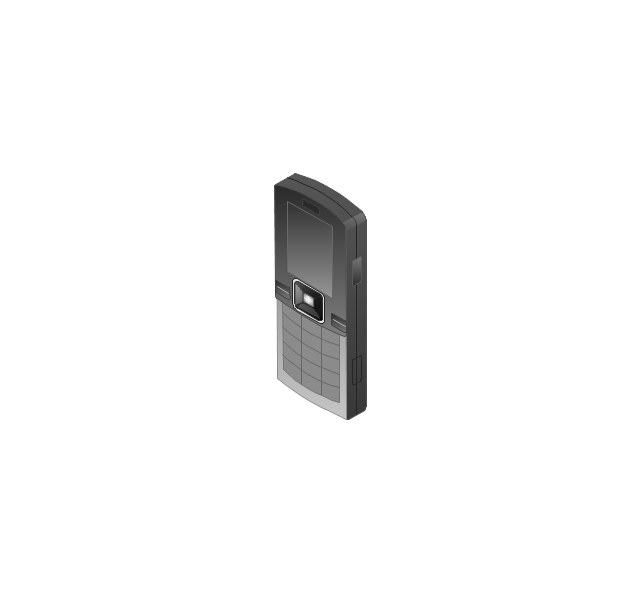
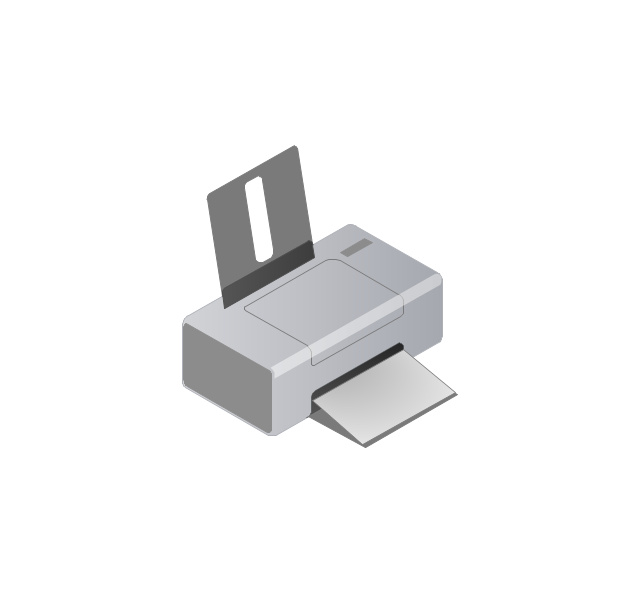
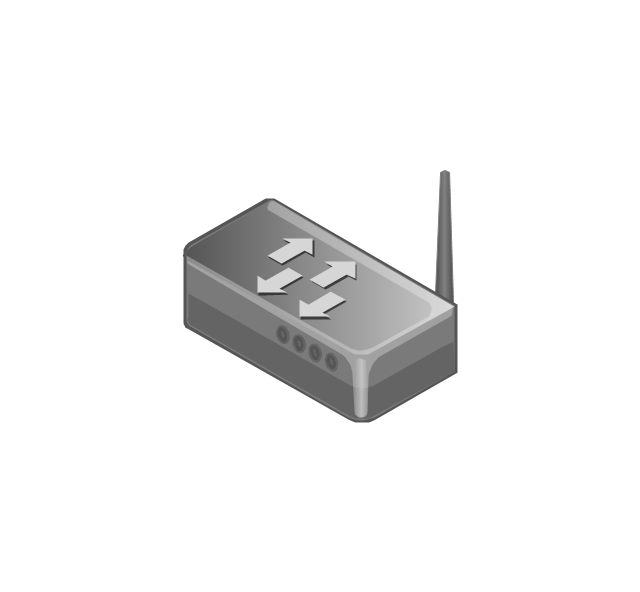
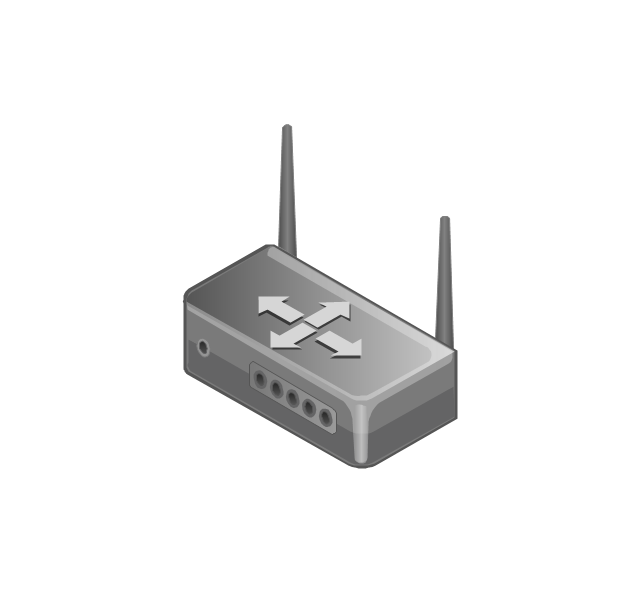
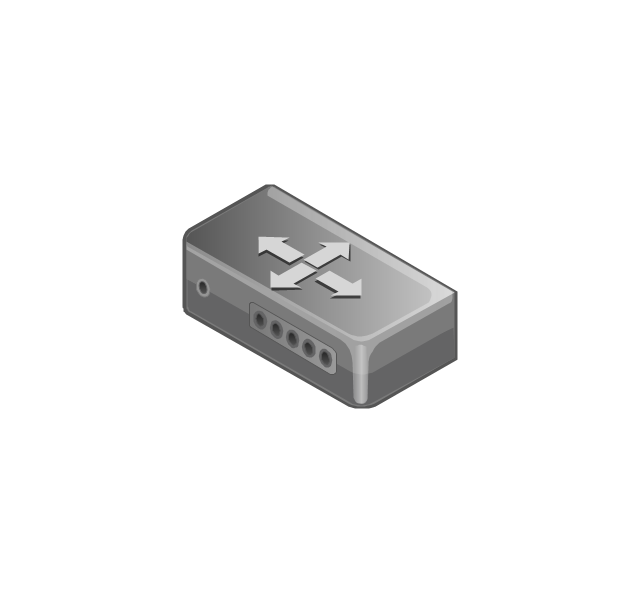
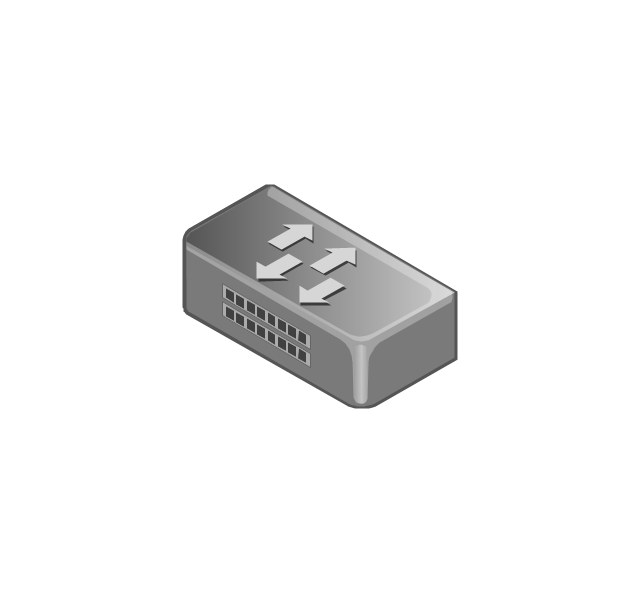
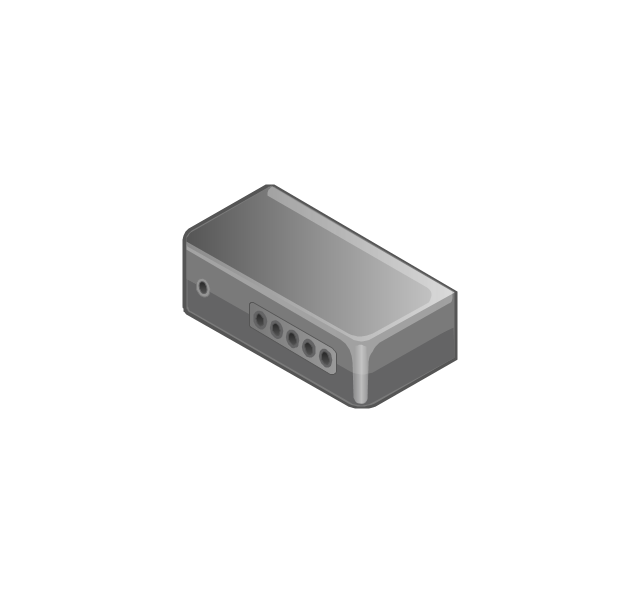
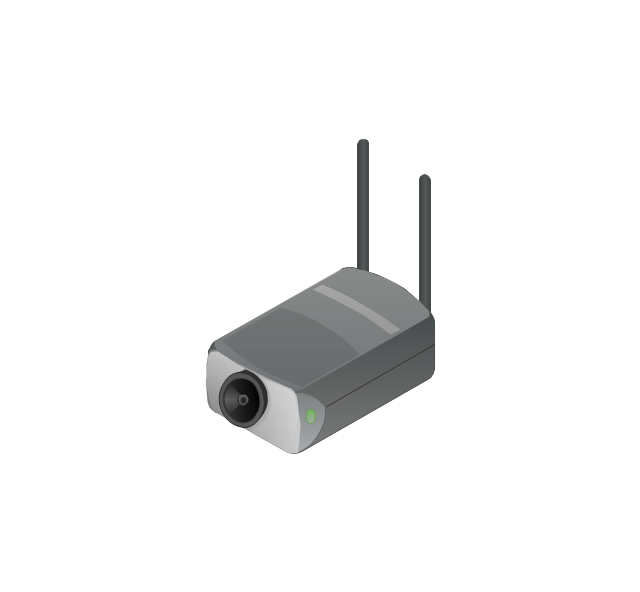
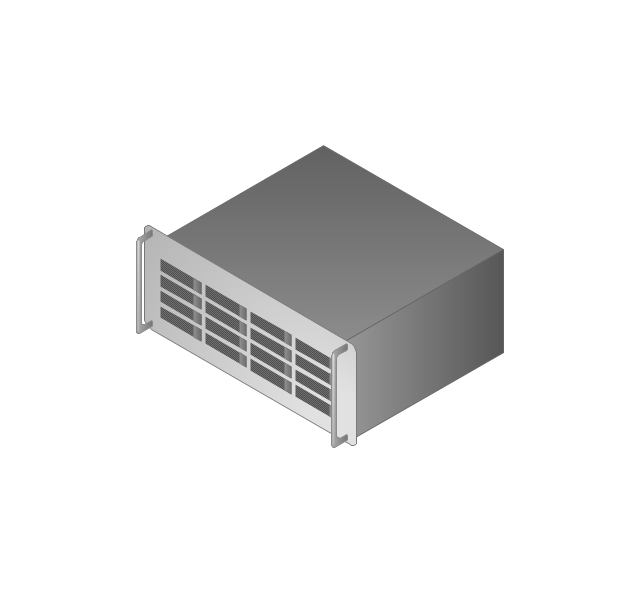
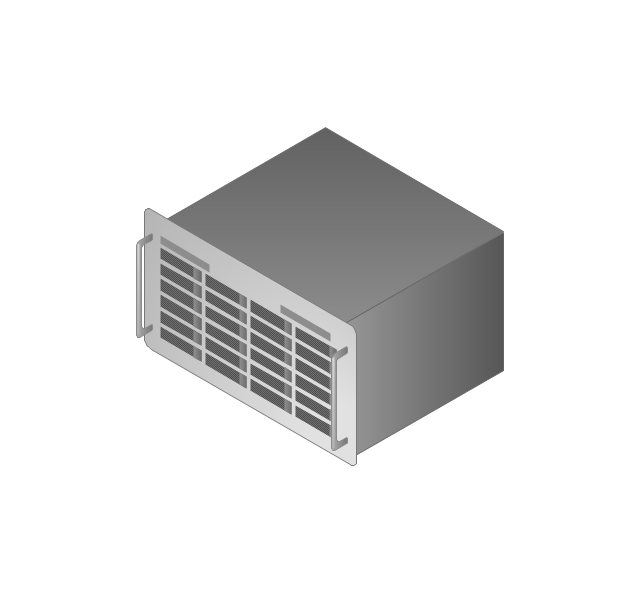
This sample was created in ConceptDraw DIAGRAM diagramming and vector drawing software using the Pie Charts Solution from Graphs and Charts area of ConceptDraw Solution Park. This sample shows the Pie Chart of the approximate air composition. You can see the percentage of oxygen, nitrogen and other gases in the air visualized on this Pie Chart.The vector stencils library "Computers and network isometric" contains 56 3D clipart images of computer and network devices and equipment for drawing network diagrams.
The clip art example "Computers and network isometric - Vector stencils library" was created using the ConceptDraw PRO diagramming and vector drawing software extended with the Computer and Networks solution from the Computer and Networks area of ConceptDraw Solution Park.
The clip art example "Computers and network isometric - Vector stencils library" was created using the ConceptDraw PRO diagramming and vector drawing software extended with the Computer and Networks solution from the Computer and Networks area of ConceptDraw Solution Park.
Television networks. Computer and Network Examples
A Television network is a telecommunications network that allows to distribute the television program content. The central operation provides programming to the many television stations or pay TV providers. This example was created in ConceptDraw DIAGRAM using the Computer and Networks Area of ConceptDraw Solution Park and shows the TV broadcasting mechanism and TV network service.
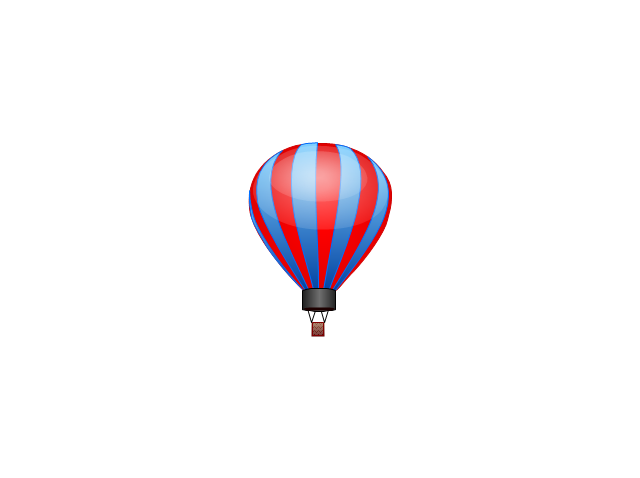
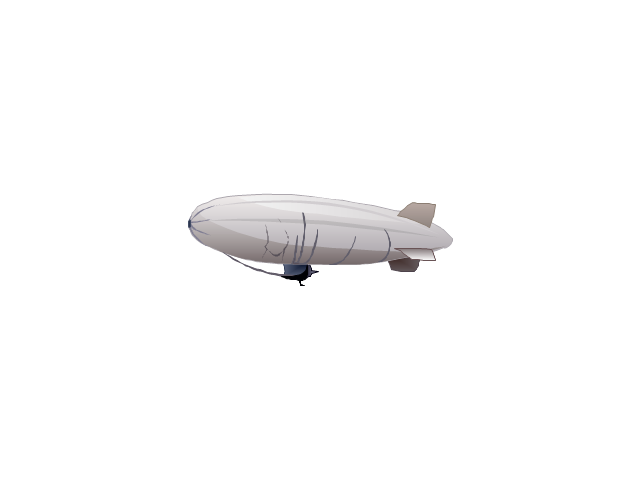
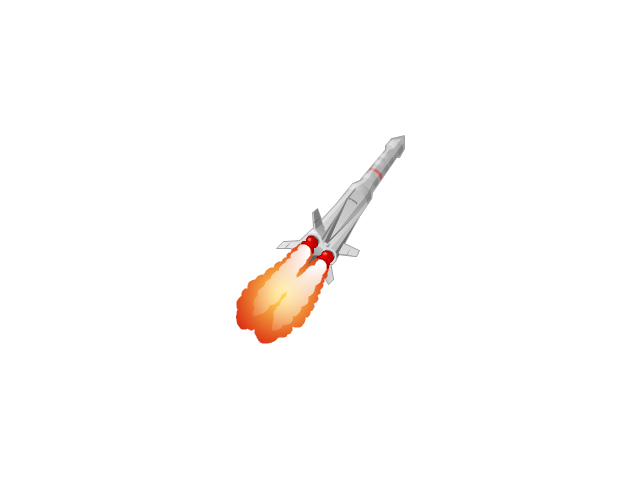
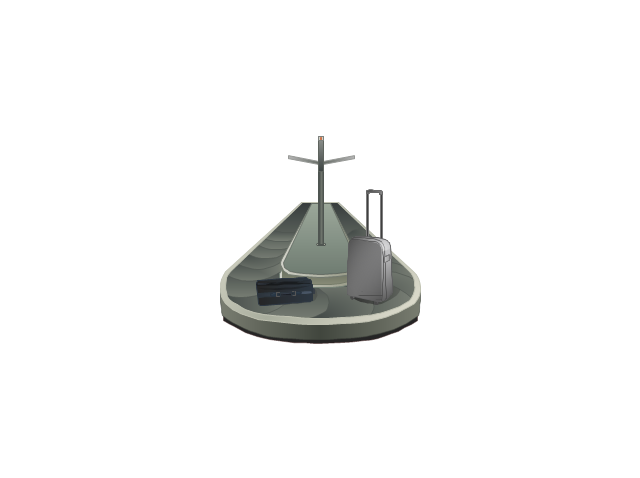
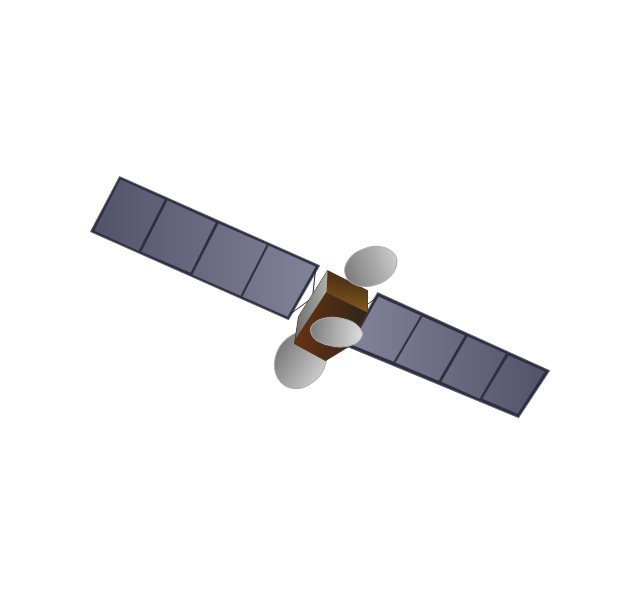
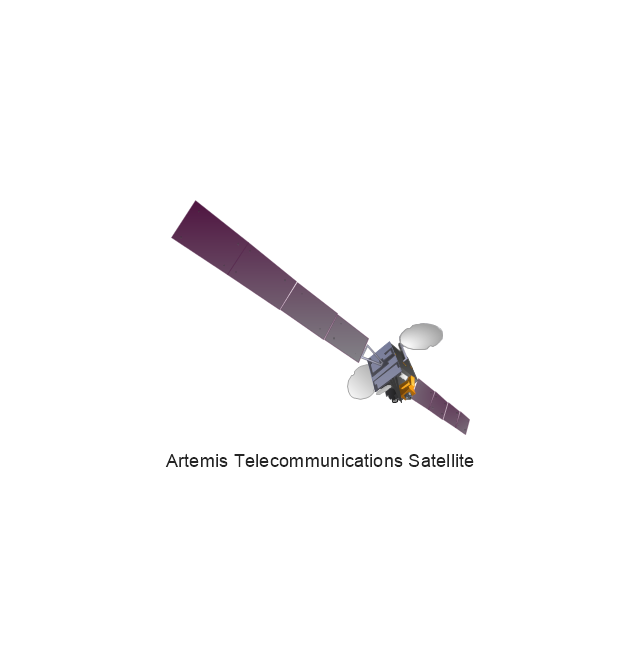
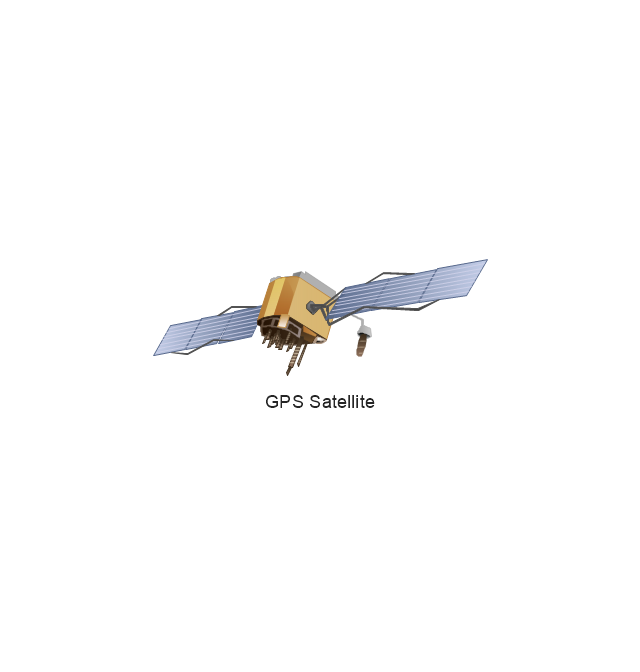
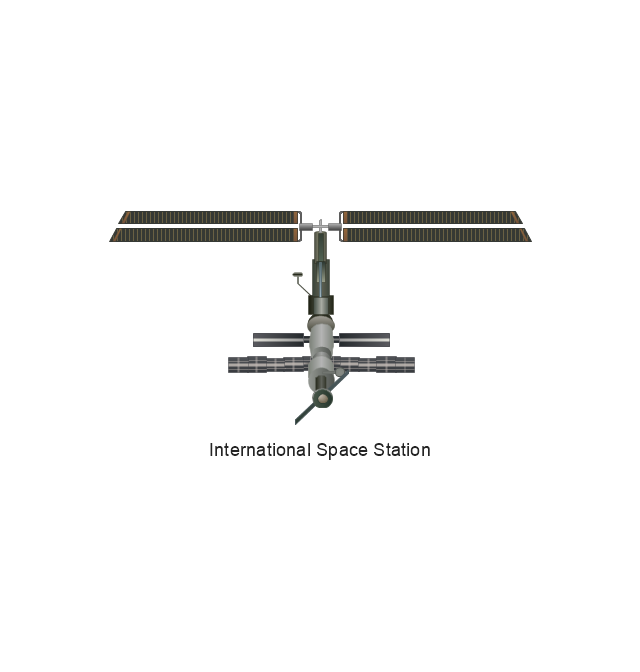
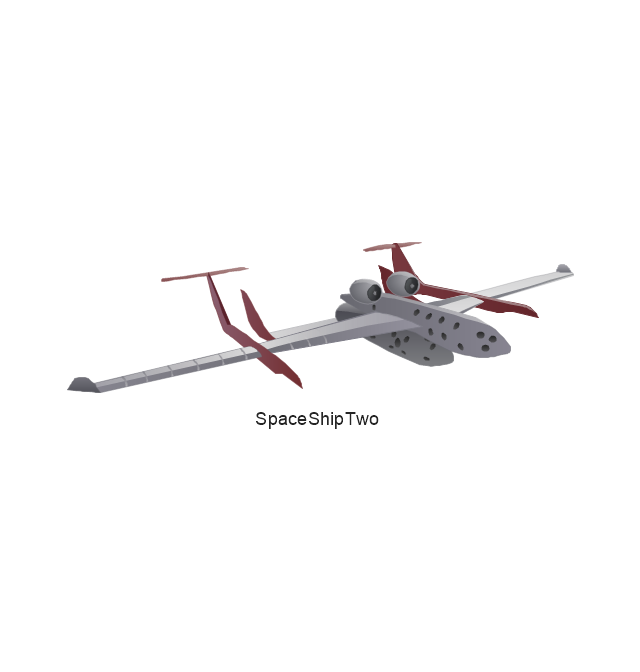
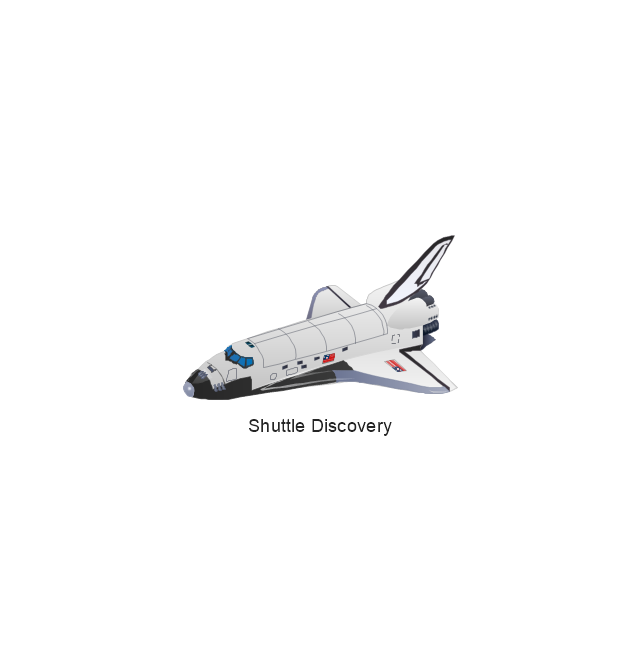
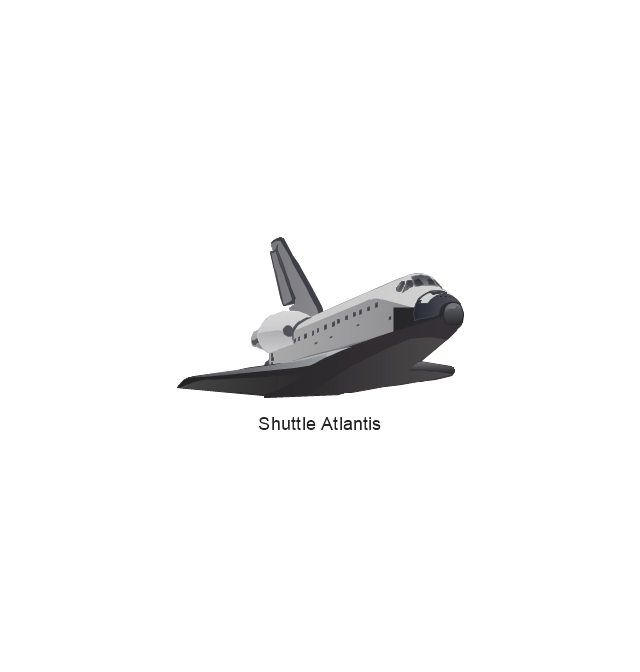
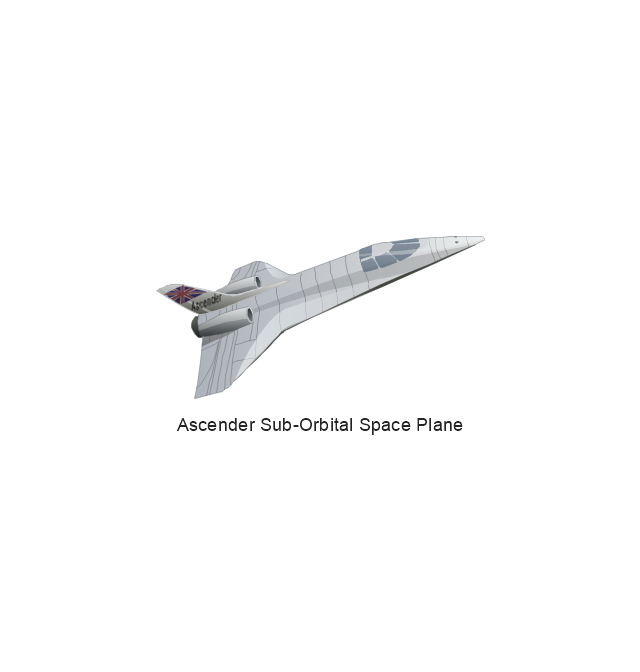
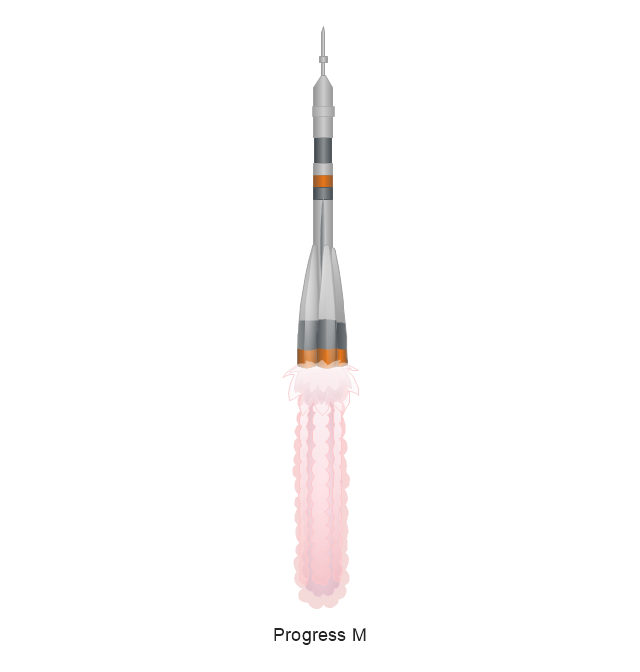
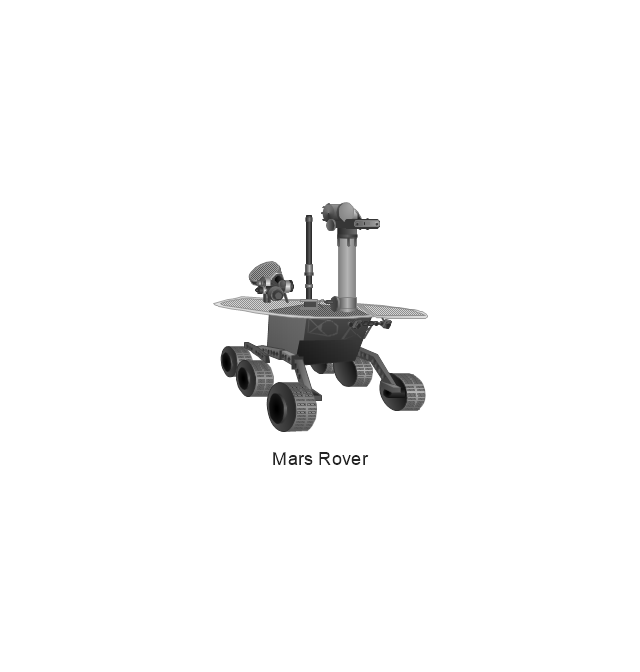
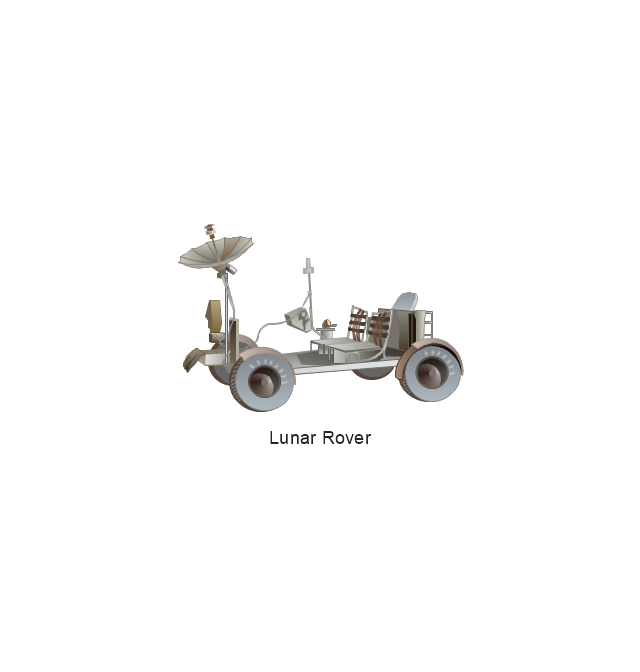
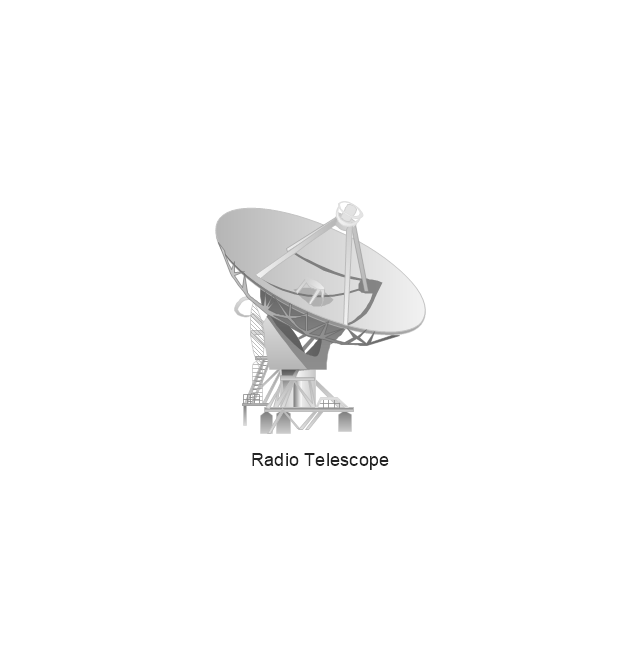
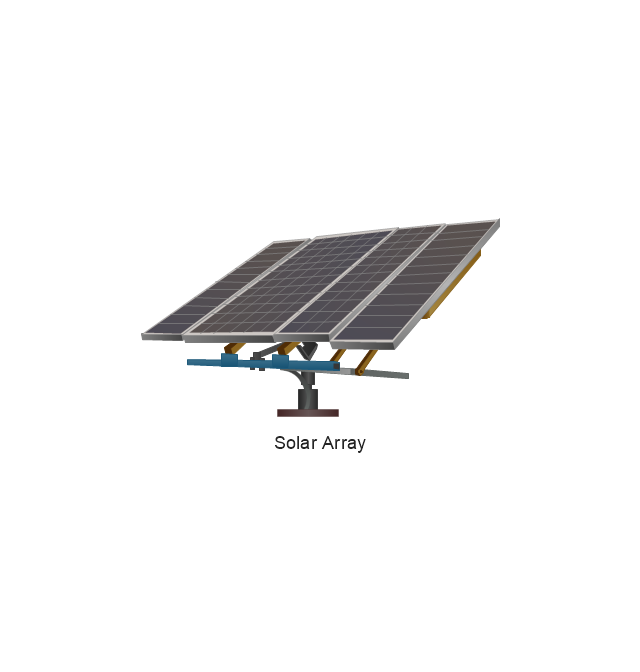
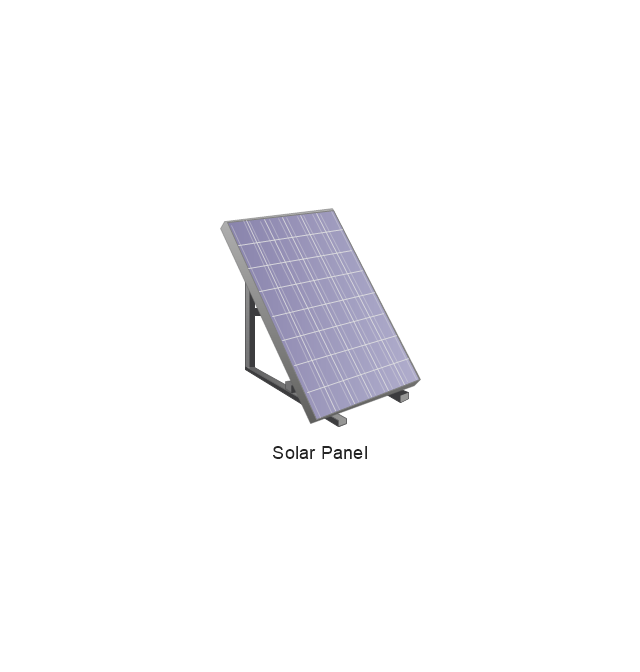
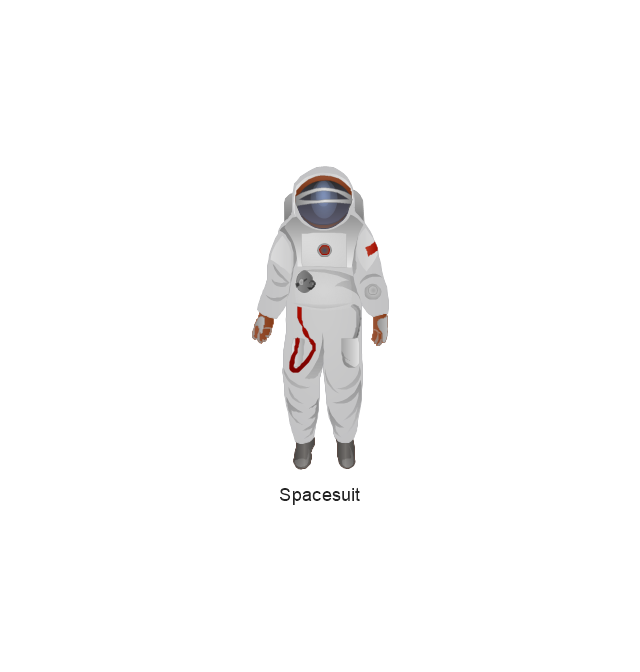
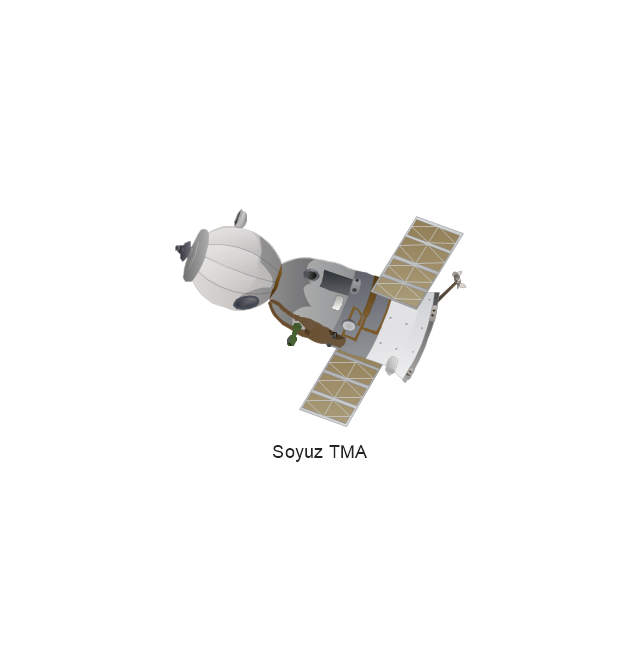
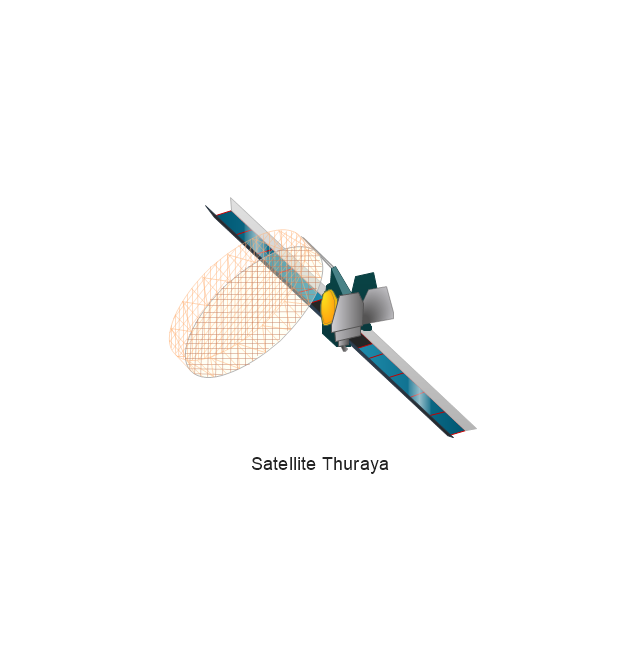
The vector stencils library "Aerospace" contains 38 clip art images for creating aerospace illustrations, presentation slides, infographics and webpages using the ConceptDraw PRO diagramming and vector drawing software.
"Aerospace describes the human effort in science, engineering and business to fly in the atmosphere of Earth (aeronautics) and surrounding space (astronautics). Aerospace organisations research, design, manufacture, operate, or maintain aircraft and/ or spacecraft. Aerospace activity is very diverse, with a multitude of commercial, industrial and military applications.
Aerospace is not the same as airspace, which is the physical air space directly above a location on the ground." [Aerospace. Wikipedia]
The vector stencils library "Aerospace" is included in the Aerospace and Transport solution from the Illustrations area of ConceptDraw Solution Park.
www.conceptdraw.com/ solution-park/ illustrations-aerospace-transport
Android User Interface
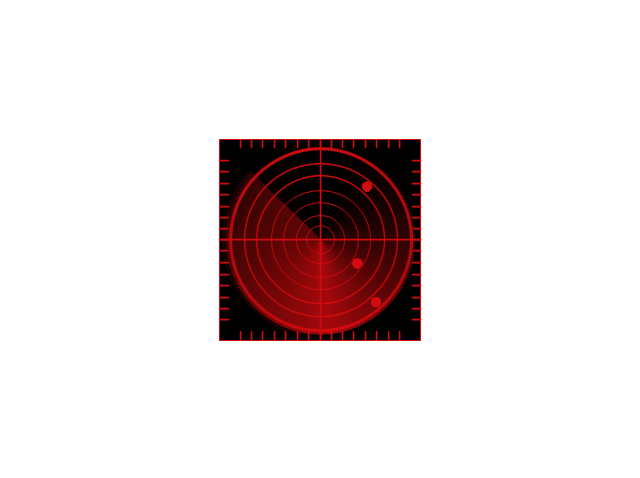
Android is a mobile operating system (OS) based on the Linux kernel and currently developed by Google. One of the most important features of any Android app is, of course, its Android User Interface. It is all what the user sees on the screen of its device and interacts with. Creating of successful Android User Interface and developing Android UI prototypes may be the mighty task. But we recommend you to make it fast and easy in ConceptDraw DIAGRAM specially extended with Android User Interface Solution from the Software Development Area.- Radar Visio Shape
- Radar Visio Stencils
- Radar Camera Symbols Visio Stencils
- Influence Diagram Software | ConceptDraw DIAGRAM Compatibility ...
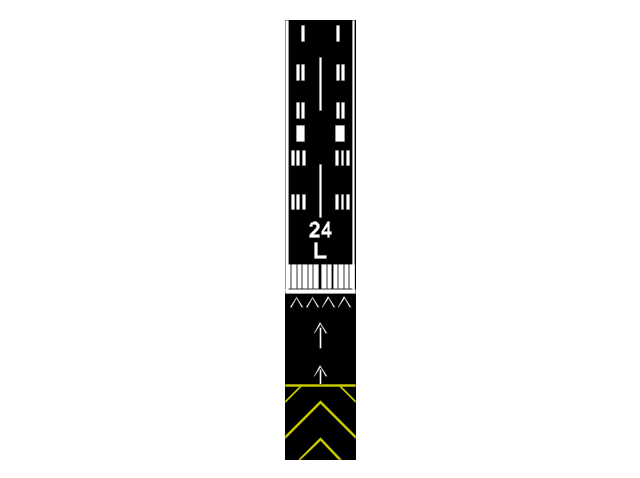
- Runway Visio Stencil
- Visio Shape Helicopter
- Aircraft - Vector stencils library | Airplane Visio Shape
- Radar Chart | Spider Chart Template | Audit Flowcharts | Spider ...
- Spider Chart Template | Radar Chart | Rainfall Bar Chart | Spider ...
- Aircraft Visio Stencil
- Visio Helicopter Stencil
- Flow Chart for Olympic Sports | Gant Chart in Project Management ...
- Visio Files and ConceptDraw | Cisco Network Objects in ...
- Radar Chart | Spider Chart Template | Audit Flowcharts | Spider ...
- Deployment Chart Software | Flow chart Example. Warehouse ...
- Fault Tree Diagram | MS Visio Look a Like Diagrams | Is ...
- Call Center Visio Stencils
- Ip Radio Military Visio Symbol
- MS Visio Look a Like Diagrams


