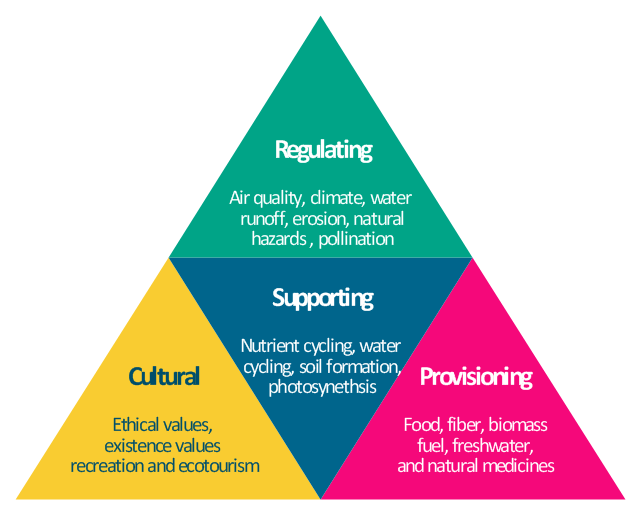
"Ecosystems represent sources of natural capital and provide goods and services to society, also called ecosystem services. The Millennium Ecosystem Assessment identified over 24 ecosystem services that can be divided up into 4 general groups including: 1) provisioning, 2) supporting, 3) regulating and 4) cultural." [User:Sawtoothgirl/ Sustainable Real Estate Development. Wikipedia]
"Humankind benefits in a multitude of ways from ecosystems. Collectively, these benefits are known as ecosystem services. Ecosystem services are regularly involved in the provisioning of clean drinking water and the decomposition of wastes. While scientists and environmentalists have discussed ecosystem services implicitly for decades, these the ecosystem services concept itself was popularized by the Millennium Ecosystem Assessment (MA) in the early 2000s. This grouped ecosystem services into four broad categories: provisioning, such as the production of food and water; regulating, such as the control of climate and disease; supporting, such as nutrient cycles and crop pollination; and cultural, such as spiritual and recreational benefits. To help inform decision-makers, many ecosystem services are being assigned economic values." [Ecosystem services. Wikipedia]
The segmented pyramid diagram example "Ecosystem goods and services" was redesigned using the ConceptDraw PRO diagramming and vector drawing software from Wikimedia Commons file ES_ triangle.png.
[commons.wikimedia.org/ wiki/ File:ES_ triangle.png]
This file is licensed under the Creative Commons Attribution-Share Alike 3.0 Unported license. [creativecommons.org/ licenses/ by-sa/ 3.0/ deed.en]
This segmented pyramid diagram example "Ecosystem goods and services" is included in the Pyramid Diagrams solution from the Marketing area of ConceptDraw Solution Park.
Pyramid Chart Examples
Pyramid Charts and Triangle Diagrams are used to visually structure the topics and progressively order the quantitative data. They allow to illustrate hierarchical structure of the topics, proportional, interconnected and containment relations among the topics. The multilevel Pyramids and Triangle diagrams are constructed oriented up or down and divided into several horizontal slices. They are effectively used to represent marketing strategies, social strategies, information systems, market value, etc., to illustrate presentations, websites, documents, reports in business, finances, sales, management, marketing, media, training, consulting, and many other fields. To maximize the efficiency in drawing the Pyramid Charts, use the ConceptDraw PRO diagramming and vector drawing software extended with Pyramid Diagrams solution from Marketing area, which contains the set of Pyramid Chart examples, samples, templates and vector design elements of triangular diagrams and pyramids with different quantity of levels for various needs.UK Map
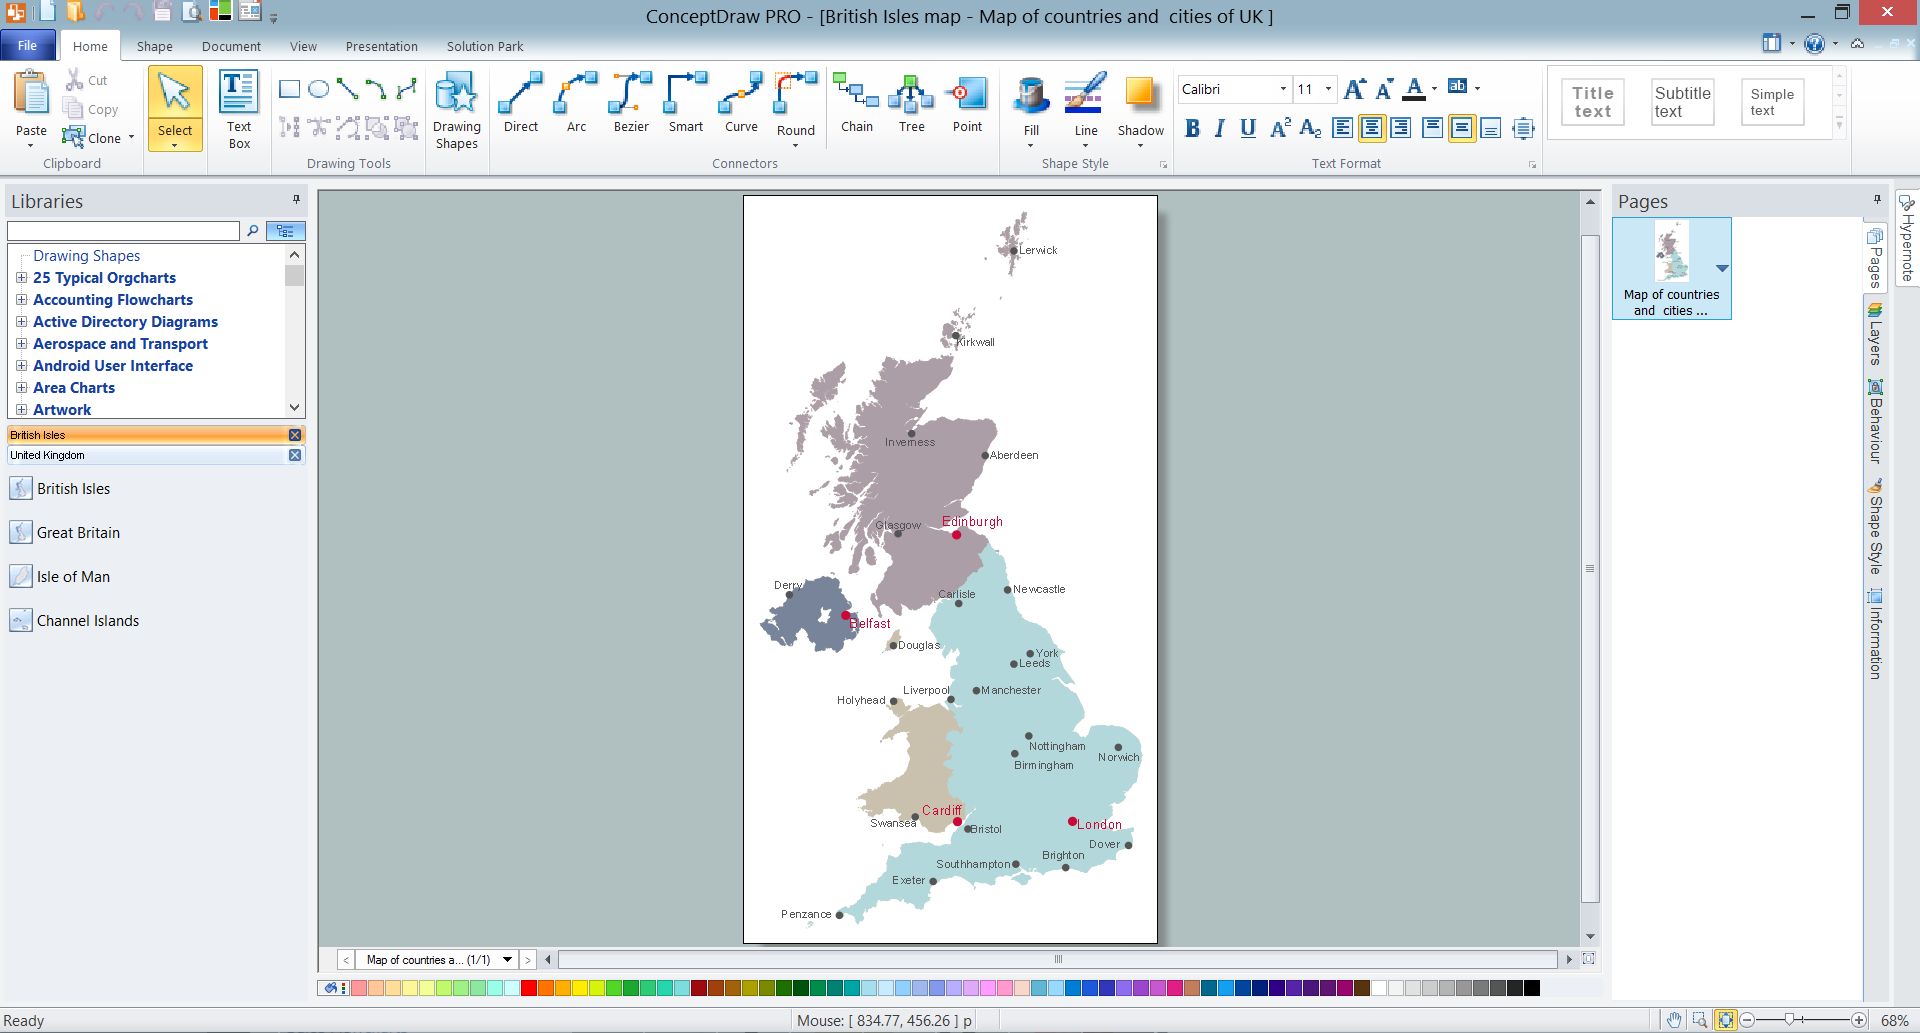
The United Kingdom of Great Britain and Northern Ireland, commonly known as the United Kingdom (UK), is a sovereign state in Europe which consists of four countries: England, Scotland, Wales, and Northern Ireland. UK is surrounded by the waters of Atlantic ocean, the North Sea, the English Channel, and the Irish Sea and includes large number of big and small islands. ConceptDraw PRO diagramming and vector drawing software offers the unique Map of UK Solution from the Maps Area of ConceptDraw Solution Park that is indispensable for easy drawing professional looking map of UK, UK counties map, UK map with cities, map of Scotland, map of England, map of Wales, Northern Ireland map.
 Pie Charts
Pie Charts are extensively used in statistics and business for explaining data and work results, in mass media for comparison (i.e. to visualize the percentage for the parts of one total), and in many other fields. The Pie Charts solution for ConceptDraw PRO v10 offers powerful drawing tools, varied templates, samples, and a library of vector stencils for simple construction and design of Pie Charts, Donut Chart, and Pie Graph Worksheets.
 Plumbing and Piping Plans
Plumbing and Piping Plans solution extends ConceptDraw PRO v10.2.2 software with samples, templates and libraries of pipes, plumbing, and valves design elements for developing of water and plumbing systems, and for drawing Plumbing plan, Piping plan, PVC Pipe plan, PVC Pipe furniture plan, Plumbing layout plan, Plumbing floor plan, Half pipe plans, Pipe bender plans.
 USA Maps
Use the USA Maps solution to create a map of USA, a US interstate map, printable US maps, US maps with cities and US maps with capitals. Create a complete USA states map.
UML Activity Diagram
UML Activity Diagram is a type of UML diagrams, which illustrates the business and operational step-by-step workflows of components within a system and shows the overall flow of control. UML Activity Diagram is constructed from a limited number of shapes, connected each other with arrows. The most important shape types are rounded rectangles, diamonds, bars, black circle, encircled black circle. The arrows represent the order in which activities happen and run from the start towards the end. ConceptDraw PRO software enhanced with Rapid UML solution is ideal for software designers and software developers who need to draw the UML Activity Diagrams and other types of UML diagrams. It is convenient to use the appropriate stencils of UML notation from the UML Activity library included to the Rapid UML solution of ConceptDraw Solution Park and containing a lot of specific vector UML objects. Use them to design your own UML Activity Diagrams, make them colorful and attractive with style tools of ConceptDraw PRO software.How to Create a Social Media DFD Flowchart
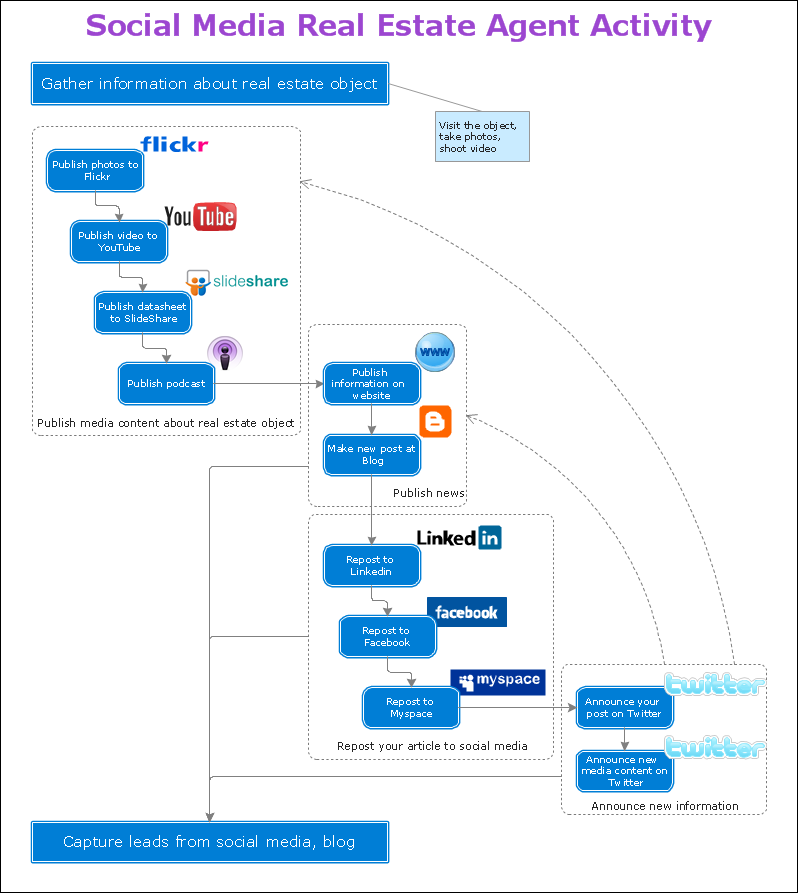
The use of social media in modern conditions helps the companies to be more effective in timely messaging - actively and rapidly response to a customer posts in social media, to find quickly the appropriate response to social media mentions, to save greatly the budget. Many companies even use the social media as a lead tool for promotion. But how to create a Social Media DFD Flowchart, Social Media Response Flowchart or Action Mind Map fast and easy? ConceptDraw PRO vector graphical software and Social Media Response solution included to ConceptDraw Solution Park assist greatly in their creation. This solution improves the quality of content in social media and helps to build an active customer community. The samples and examples included to Social Media Response solution are helpful for social media teams in developing a social media strategy, in refining and organizing the response process, in creation training materials by trainers and consultants for education the social media groups on how to accomplish the most effectiveness in their daily work.
 Sales Flowcharts
The Sales Flowcharts solution lets you create and display sales process maps, sales process workflows, sales steps, the sales process, and anything else involving sales process management.
Work Order Process Flowchart. Business Process Mapping Examples
The business process is a set of actions or tasks which are undertaken by an organization for production some goods or services, they are then offered for the customers and are ordered by them. Process Flowcharts and Order Process Flowcharts are sufficiently prevalent, well known and actively used in variety of fields of life, business and science. They are constructed using the common standardized symbols, thus are clear and understandable for all. They help effectively represent the processes, determine the order in which the process activities happen, document the order processes, and also effectively analyze the processes with a goal to increase their efficiency. Create your own Process Flowcharts, Order Process Flowcharts, Cross-Functional Flow Charts representing the order processing steps using powerful drawing tools of ConceptDraw PRO software and variety of predesigned vector objects from the libraries of Business Process Mapping Solution from Business Processes area of ConceptDraw Solution Park.How To Draw Building Plans
Building Plan is the basis for implementation construction and repair works. Creation of Building Plans is the main purpose of architects and designers. They are required and even obligatory for builders to accurately implement your wishes and ideas during the building, designing or redesigning your home, flat, office, or any other premise. ConceptDraw PRO is a powerful quick building plan software for creating great-looking Office layouts, Home floor plans, Commercial floor plans, Storage building plans, Expo and Shopping mall building plans, School and Training building plans, Cafe or Restaurant plans, Gym and Spa area plans, Sport field plans, House interior designs, Electric and Telecom building plans, Fire and Emergency plans, HVAC plans, Security and Access plans, Plumbing and Piping plans, Plant layouts, etc. Use helpful samples, templates and variety of libraries with numerous building design elements from Floor Plans solution for ConceptDraw PRO software to facilitate design drawing process.
 Entity-Relationship Diagram (ERD)
Entity-Relationship Diagram (ERD) solution extends ConceptDraw PRO software with templates, samples and libraries of vector stencils from drawing the ER-diagrams by Chen's and crow’s foot notations.
Organizing and Selecting Social Media Response Action
Interactive tool helps you find the appropriate response to social media mentions quickly.UML Deployment Diagram
UML Deployment Diagram depicts the physical deployment of artifacts on nodes (nodes are the existing hardware components, artifacts are the software components running on each node); and how the different pieces are connected. Use ConceptDraw PRO with UML deployment diagram templates, samples and stencil library from Rapid UML solution to model the physical deployment of artifacts on nodes of your software system.
UML Use Case Diagram Example - Estate Agency
UML Diagram Estate Agency. This sample was created in ConceptDraw PRO diagramming and vector drawing software using the UML Use Case Diagram library of the Rapid UML Solution from the Software Development area of ConceptDraw Solution Park. This sample shows the work of the estate agency and is used by the estate agencies, building companies, at the trainings of the estate agencies, for understanding the working processes of the estate agencies.- Real Estate Marketing Presentation Vector Png
- UML deployment diagram - Real estate transactions | 4 Level ...
- Real Estate Vector Png
- Bathroom Sink Png
- Apartment Vector Front Png
- Rent House Png Image
- Interface Serial Png
- Png Furniture Plan File
- Social media activity of a real estate agent
- Goods And Services Png
- Bedroom Furniture Png For Plan
- Desk Plan Png
- Pyramid In Png
- Meeting Room Vector Png
- Transaction Png
- Scale Map Png
- Goods And Services Clipart Png
- Screen Apple Png
- Production Png
- Interior Design Floor Plan Sketches Png


