Rack Diagrams
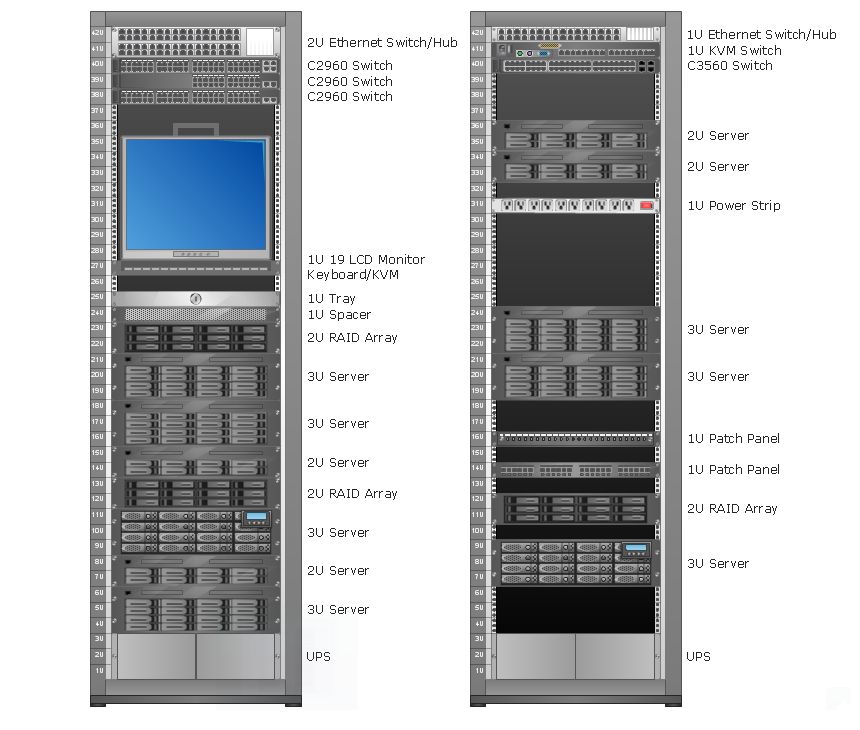
Rack Diagrams visualize the rack mounting of computer and network equipment as the drawing of frontal view of the rack with equipment installed. They are used for choosing the equipment or racks to buy, and help to organize equipment on the racks virtually, without the real installation.
Network Diagrams for Bandwidth Management
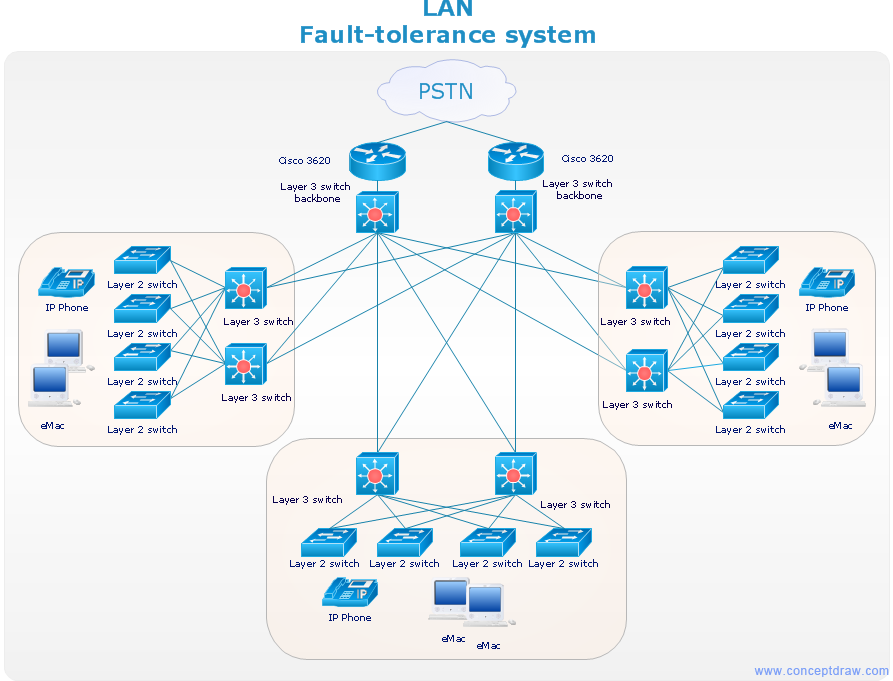
A perfect tool to draw network diagram for bandwidth management. Computer & Networks solution provides the symbol libraries with pre-designed network graphic elements. Use Computer & Networks solution to draw the network diagrams for bandwidth management for Cisco networks, Apple networks, IVR networks, GPRS networks, wi-fi networks, LAN and WAN.
Design Element: Rack Diagram for Network Diagrams
ConceptDraw DIAGRAM is perfect for software designers and software developers who need to draw Rack Diagrams.
Software development with ConceptDraw DIAGRAM
Modern software development requires creation of large amount of graphic documentation, these are the diagrams describing the work of applications in various notations and cuts, also GUI design and documentation on project management. ConceptDraw DIAGRAM technical and business graphics application possesses powerful tools for software development and designing technical documentation for object-oriented projects. Solutions included to the Software Development area of ConceptDraw Solution Park provide the specialists with possibility easily and quickly create graphic documentation. They deliver effective help in drawing thanks to the included package of templates, samples, examples, and libraries with numerous ready-to-use vector objects that allow easily design class hierarchies, object hierarchies, visual object-oriented designs, flowcharts, GUI designs, database designs, visualize the data with use of the most popular notations, including the UML and Booch notations, easy manage the development projects, automate projection and development.HelpDesk
How to Create a Time Series Dashboard
Time Series Dashboard means integration of some type of diagrams: Line Charts, Bar Charts, Column Charts, and Dot Plots on a single space. The ConceptDraw Time Series Dashboard solution can be used to create the interactive Time Series dashboard. The libraries of Time Series Charts solution contain the Live Objects, that can change their appearance depending on the external data. Each chart from the Time Series dashboard displays particular source data. You can include Time Series Charts in your business or technical dashboards to show and compare the items changing over time.HelpDesk
How to Create a CCTV Diagram
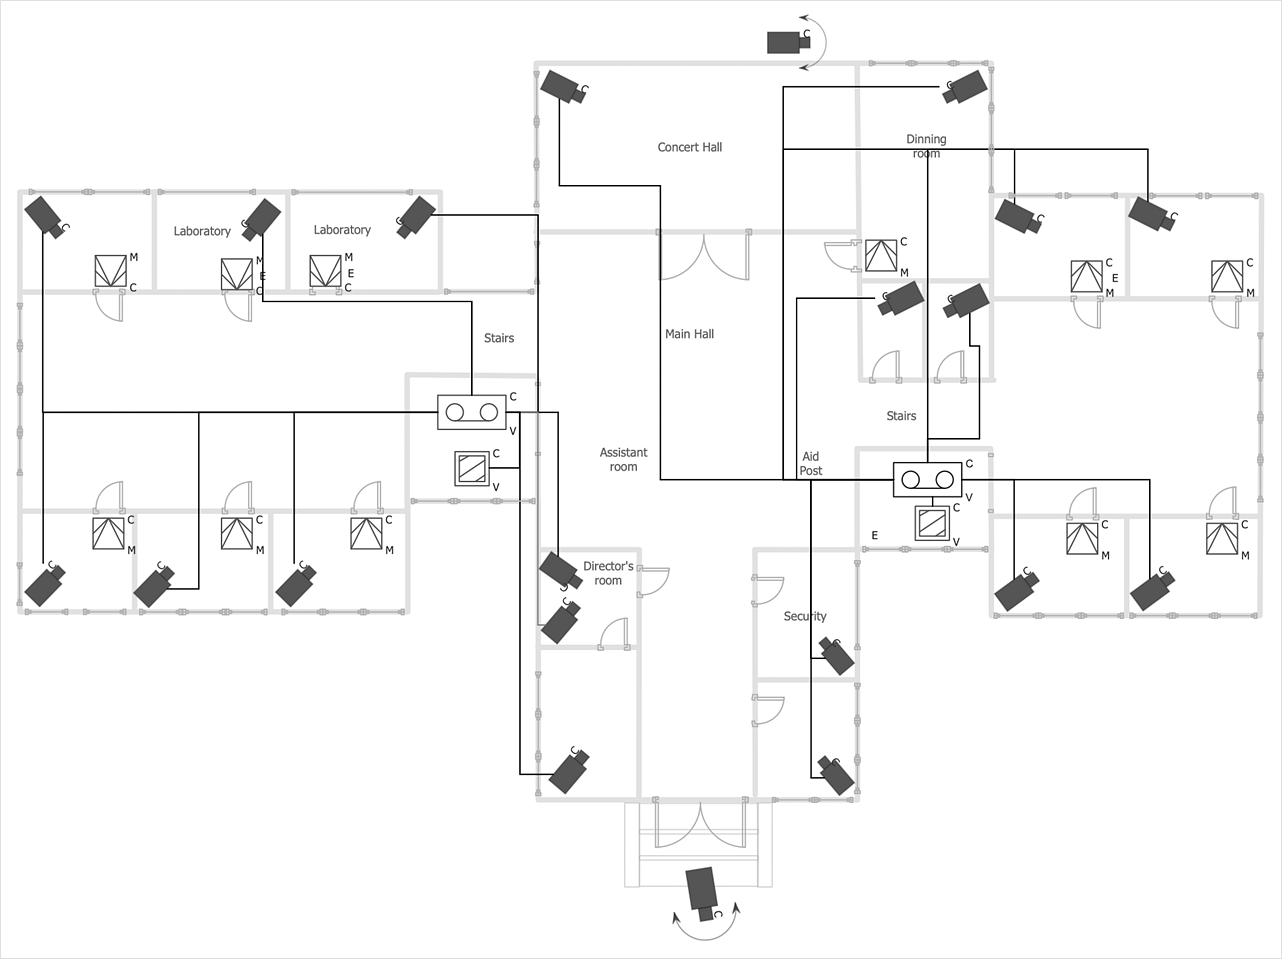
CCTV (Closed-circuit television) diagram is used to depict a system of video monitoring. The CCTV diagram provides video cameras placement strategy. CCTV diagram should include the scheme of strategic placement of video cameras, which capture and transmit videos to either a private network of monitors for real-time viewing or to a video recorder for later reference. CCTV is commonly used for surveillance and security purposes. Using ConceptDraw DIAGRAM with the Security and Access Plans Solution lets you create professional looking video surveillance CCTV system plans, security plans, and access schemes.- Real Time Application Of Ring Topology
- Network Topology Real Time Example
- Star Topology Real Time Example
- Topology Diagrams With Real Time Example
- Ring Topology Real Life Example
- Mobile Network Uml Project In Real Time Example
- Star Topology Examples Real Life
- Bus Network Topology | Network Topologies | Fully Connected ...
- Network Glossary Definition | Real Time Problem Of Ring Topology
- How to Add a Wireless Network Diagram to a PowerPoint ...
- Daisy Chain Network Topology | CCTV Network Example | Audio ...
- Cisco Network Topology . Cisco icons, shapes, stencils and symbols ...
- Real Life Example Of Mesh Topology
- Hotel Network Topology Diagram | Network Topologies | Hotel ...
- Star Network Topology | Hybrid Network Topology | Cisco Network ...
- CCTV Network Example | Daisy Chain Network Topology | Basic ...
- Network Diagram Software ISG Network Diagram
- Basic CCTV System Diagram. CCTV Network Diagram Example ...
- Hybrid Network Topology | Star Network Topology | Cisco Network ...
- Fully Connected Network Topology Diagram | Communication ...


.png)


