Program Evaluation and Review Technique (PERT) with ConceptDraw PRO
Program Evaluation and Review Technique (abbr. PERT) is a method developed by Ministry of Defense of the USA in 1958 for the project of creation the missile system Polaris. PERT diagram is one of the tools for project management that lets greatly simplify the planning and scheduling of large and complex projects. PERT diagram provides evaluation of project run-time and labor forces, it helps to analyze the time necessary for execution each of project tasks and the whole project, and to calculate the project critical path. PERT chart depicts the set of tasks connected each other in order of their execution and is constructed according to one of definite rules - AOA (activity on arrow) or AON (activity on node). It doesn't give you ready concrete decisions, but helps to find them. Design easy the PERT diagrams in ConceptDraw PRO software enhanced with Seven Management and Planning Tools solution from Management area of ConceptDraw Solution Park. You have a possibility to build the PERT chart of any type, but AON variant is easier for building and perception.Presenting a Slide Show to a Group of People
Tips on how to present a slide show to a group. Deliver a successful presentation to your team.
Planning a Trip with ConceptDraw Project
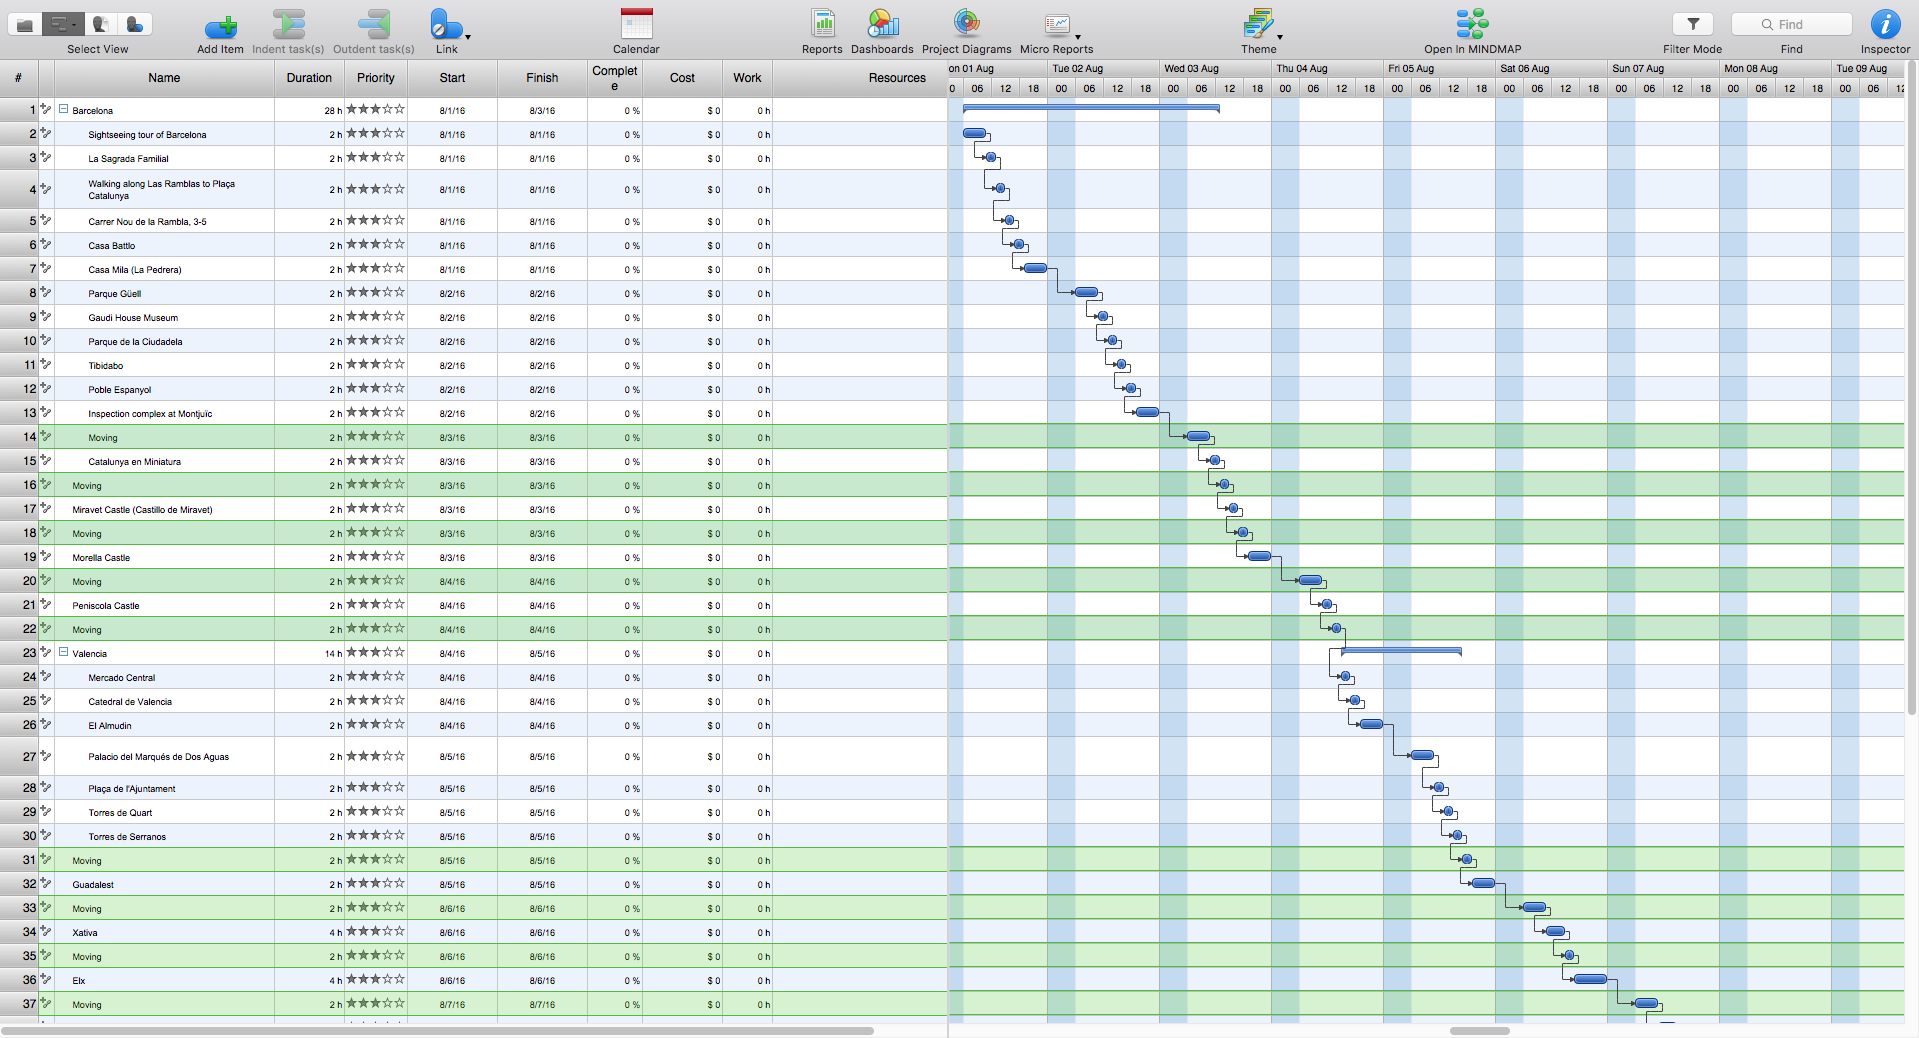
Planning a trip is real work; and the better this work is done, the more chances you have to enjoy an interesting itinerary and the trip in general. A good plan is never overloaded. It is always good to stick to the golden mean. Surely, you can create a perfectly accurate and detailed route. However, following it may become a hard task, which will turn your trip from a pleasure into a race to fulfil your own plan.Activity Network (PERT) Chart
Activity Network and Project Evaluation and Review Technique, or PERT, charts are a way of documenting and analyzing the tasks in a project. This diagram is constructed as part of the process in creating a schedule of corrective actions. The Activity Network Chart (PERT) shows the logical connections and consequence of tasks to be performed. It displays the time period for problem solving and the implementation of all activities through the critical path.Product Overview
ConceptDraw PROJECT is a vigorous tool for managing single or multiple projects. It lets you determine all essential elements involved into project, control schedules, resources and finances, and monitor projects' progress in most effective yet simple manner.
 Timeline Diagrams
Timeline Diagrams solution extends ConceptDraw PRO diagramming software with samples, templates and libraries of specially developed smart vector design elements of timeline bars, time intervals, milestones, events, today marker, legend, and many other elements with custom properties, helpful for professional drawing clear and intuitive Timeline Diagrams. Use it to design simple Timeline Diagrams and designate only the main project stages, or highly detailed Timeline Diagrams depicting all project tasks, subtasks, milestones, deadlines, responsible persons and other description information, ideal for applying in presentations, reports, education materials, and other documentation.
Functional Flow Block Diagram
You need to draw a Functional Flow Block Diagram? You are an artist? Now it doesn't matter. With Block Diagrams solution from the "Diagrams" area for ConceptDraw Solution Park you don't need more to be an artist to design the Functional Flow Block Diagram of any complexity.Software development with ConceptDraw Products
Internet solutions on ConceptDraw base. What may interest developers of Internet solutions.Basic Flowchart Symbols and Meaning
Flowcharts are the best for visually representation the business processes and the flow of a custom-order process through various departments within an organization. ConceptDraw PRO diagramming and vector drawing software extended with Flowcharts solution offers the full set of predesigned basic flowchart symbols which are gathered at two libraries: Flowchart and Flowcharts Rapid Draw. Among them are: process, terminator, decision, data, document, display, manual loop, and many other specific symbols. The meaning for each symbol offered by ConceptDraw gives the presentation about their proposed use in professional Flowcharts for business and technical processes, software algorithms, well-developed structures of web sites, Workflow diagrams, Process flow diagram and correlation in developing on-line instructional projects or business process system. Use of ready flow chart symbols in diagrams is incredibly useful - you need simply drag desired from the libraries to your document and arrange them in required order. There are a few serious alternatives to Visio for Mac, one of them is ConceptDraw PRO. It is one of the main contender with the most similar features and capabilities.
Project Timeline
Project timeline is a type of chart which allows visually represent the chronology of works for the project, placing the key points of the project (milestones) on a timescale. You need to make professional looking project timeline? Create it with ConceptDraw PRO! ConceptDraw PRO extended with Timeline Diagrams Solution from the Management Area is the best timeline diagrams software- Sample Of Gantt Chart For Project Proposal
- Gantt chart examples | Gant Chart in Project Management | Gantt ...
- Gantt chart examples | Gant Chart in Project Management | How to ...
- How to Operate with Project Time Frames in ConceptDraw ...
- Gantt chart examples | Gant Chart in Project Management | Gantt ...
- How to Create Presentation of Your Project Gantt Chart | How to ...
- Best Software for Making Presentations | Gantt Chart Diagram | How ...
- Gantt chart examples | Good Flow Chart app for Mac | Product ...
- Gant Chart in Project Management | What is Gantt Chart (historical ...
- Gantt Chart Diagram | Project — Working With Costs | Best Software ...


