ConceptDraw PRO DFD Software
Our DFD software ConceptDraw PRO allows you to quickly create DFD with data storages, external entities, functional transforms, data flows, as well as control transforms and signals. DFD program ConceptDraw PRO has hundreds of templates, and a wide range of libraries with all nesassary ready-made drag-and-drop.HelpDesk
How to Use ConceptDraw Sales Dashboard Solution
The interactive visual dashboard is a valuable tool for any sales team. Sales dashboard allows you to view and monitor sales indicators that are important for manager and sales staff . It helps to use the timely and reliable information to improve the quality of sales performance and increase sales revenues. ConceptDraw Sales Dashboard solution is a tool for both: sales manager and sales team. It provides the visualization of key performance indicators that are critical to the entire sales organization. The custom sales dashboard displays the real-time information on sales performance KPIs with the help of intuitive and easy-to-understand diagrams and charts. Sales Dashboard helps the entire team see where they are, and what needs to be done. With ConceptDraw PRO you can easily create a visual Sales Dashboard using Live Objects Technology.
Product Overview
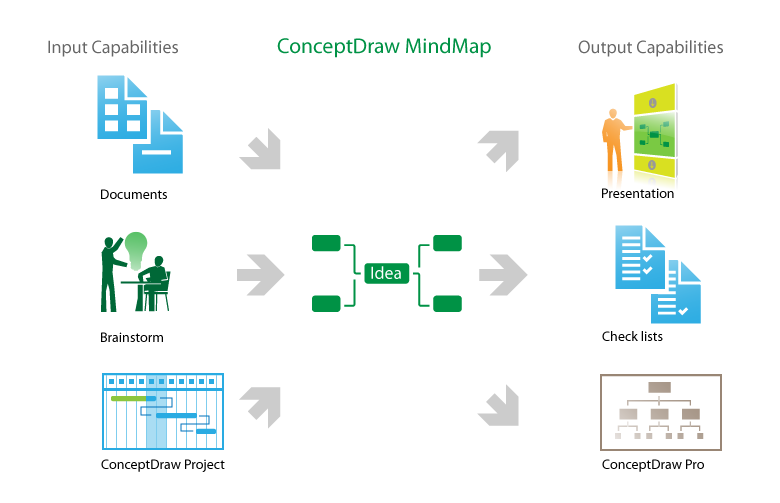
The role of ConceptDraw MINDMAP is to organize and plan idea development and communicate between process participants. Mind maps are convenient to prepare presentations for team and management and send task lists and related information.HelpDesk
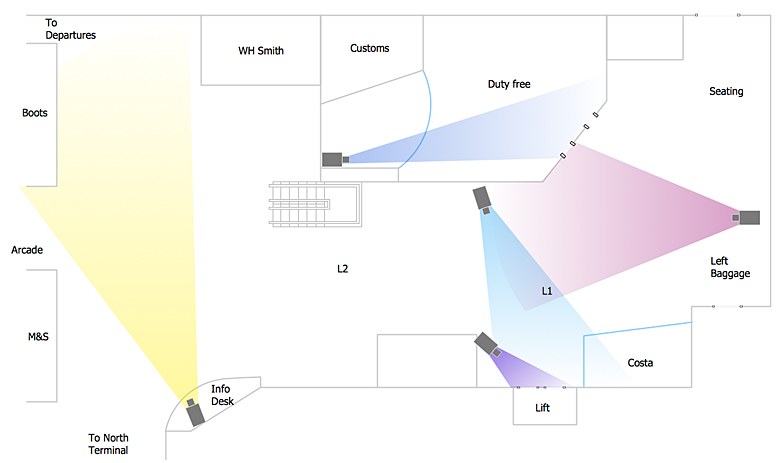
How to Create a CCTV Diagram in ConceptDraw PRO
CCTV (Closed circuit television) diagram is used to depict a system of video monitoring. The CCTV diagram provides video cameras placement strategy. CCTV diagram should include the scheme of strategic placement of video cameras, which capture and transmit videos to either a private network of monitors for real-time viewing, or to a video recorder for later reference. CCTV is commonly used for surveillance and security purposes. Using ConceptDraw PRO with the Security and Access Plans Solution lets you create professional looking video surveillance CCTV system plans, security plans, and access schemes.HelpDesk
How to Connect Text Data to a Time Series Chart on Your Live Dashboard
Time Series Dashboard means an integration of some type of diagrams: Line Charts, Bar Charts, Column Charts, and Dot Plots on a single space. The ConceptDraw Time Series Dashboard solution can be used to create the interactive Time Series dashboard. The libraries of Time Series Charts solution contain the Live Objects, that can change their appearance depending on the external data. Each chart from the Time Series dashboard displays particular source data. You can include Time Series Charts in your business or technical dashboards to show and compare the items changing over time.
- UML Sample Project | Total Quality Management TQM Diagrams ...
- Credit Card Processing System UML Diagram | Basic Flowchart ...
- Tree Network Topology Diagram | Network Diagram Software LAN ...
- Tree Network Topology Diagram | Network Glossary Definition ...
- Tool for Workgroup Briefings, Meetings and Decisions | UML ...
- Diagramming Software for Design UML Collaboration Diagrams ...
- Credit Card Processing System UML Diagram | Unified ...
- Diagramming Software for Design UML Collaboration Diagrams ...
- Topology Diagrams With Real Time Example
- Communication Diagram UML2.0 / Collaboration UML1.x ...
- Project Results
- Deployment Diagram For Chat Application
- Online Project Tools
- Computers and Communications | Unified communications diagram ...
- Project Objectives Template
- CORRECTIVE ACTIONS PLANNING. Risk Diagram (PDPC) | How ...
- Online Project Collaboration Software
- Diagramming Software for Design UML Communication Diagrams ...
- Business Project Sample
- Unified communications diagram | GPRS network diagram ...


