This site uses cookies. By continuing to browse the ConceptDraw site you are agreeing to our Use of Site Cookies.

Bar Diagrams for Problem Solving. Create event management bar charts with Bar Graphs Solution

Create bar charts for event management problem solving and visual data comparison using the ConceptDraw PRO diagramming and vector drawing software extended with the Bar Graphs Solution from the Graphs and Charts area of ConceptDraw Solition Park.
HelpDesk

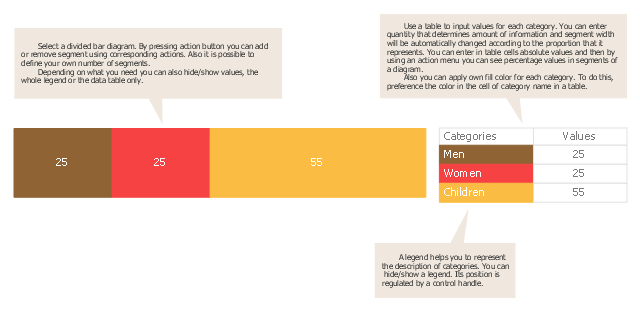
How to Draw a Divided Bar Chart in ConceptDraw PRO

A divided bar graph is a rectangle divided into smaller rectangles along its length in proportion to the data. Segments in a divided bar represent a set of quantities according to the different proportion of the total amount. A divided bar diagram is created using rectangular bars to depict proportionally the size of each category. The bars in a divided bar graph can be vertical or horizontal. The size of the each rectangle displays the part that each category represents. The value of the exact size of the whole must be known, because the each section of the bar displays a piece of that value. A divided bar diagram is rather similar to a sector diagram in that the bar shows the entire data amount and the bar is divided into several parts to represent the proportional size of each category. ConceptDraw PRO in conjunction with Divided Bar Diagrams solution provides tools to create stylish divided bar charts for your presentations.
Use this chart template to design your divided bar diagrams.
A divided bar chart is a rectangle divided into segments, illustrating numerical proportion. In a divided bar chart, the length of each segment (and consequently its area), is proportional to the quantity it represents.
This divided bar graph displays the number of people per day who visited swimming pool.
The template "Divided bar diagram" for the ConceptDraw PRO diagramming and vector drawing software is included in the Divided Bar Diagrams solution from the Graphs and Charts area of ConceptDraw Solution Park.
Template
Template, divided bar diagram,

Bar Chart

ConceptDraw PRO extended with Bar Graphs solution from Graphs and Charts area of ConceptDraw Solution Park is ideal software for quick and simple drawing bar chart of any complexity graph.

Column Chart Examples

Column chart examples from ConceptDraw collection can help you find the best visual depiction for you data. You can easily modify column chart examples according to data you want to visualize.

Divided Bar charts, Basic Divided Bar Diagrams Basic Divided Bar Diagrams

Divided Bar charts, Basic Divided Bar Diagrams
This solution extends the capabilities of ConceptDraw PRO v10.3.0 (or later) with templates, samples and a library of vector stencils for drawing Divided Bar diagrams.

Relative Value Chart Software

Relative value is a value measured in the terms of liquidity, risks, return of one investment or financial instrument relative to another.
Relative values are widely used in:business, economics, investment, management, marketing, statistics, etc.
ConceptDraw PRO software is the best for drawing professional looking Relative Value Charts. ConceptDraw PRO provides Divided Bar Diagrams solution from the Graphs and Charts Area of ConceptDraw Solution Park.
HelpDesk

How to Create a Bar Chart in ConceptDraw PRO

Bar charts (bar graphs) are diagrams displaying data as horizontal or vertical bars of certain heights.
Bar charts are widely used to show and compare the values of the same parameters for different data groups.
The bar graph can be vertical or horizontal. This depends on the amount of categories. There are many methods in which bar graph can be built and this makes it a very often used chart type. Usually, a bar chart is created so that the bars are placed vertically. Such arrangement means that the bar's height value is proportional to the category value. Nevertheless, a bar chart can be also drawn horizontally. This means that the longer the bar, the bigger the category. Thus, a bar chart is a good way to present the relative values of different measured items. The ConceptDraw Bar Graphs solution allows you to draw a bar chart quickly using a vector library, containing the set of various bar charts objects.

Bar Chart Examples

Complete set of bar chart examples is produced using ConceptDraw software. Surfing bar chart examples you can find an example that is the best for your case.

Rainfall Bar Chart

This sample shows the Horizontal Bar Chart of the average monthly rainfalls.
This sample was created in ConceptDraw PRO diagramming and vector drawing software using the Bar Graphs Solution from the Graphs and Charts area of ConceptDraw Solution Park.