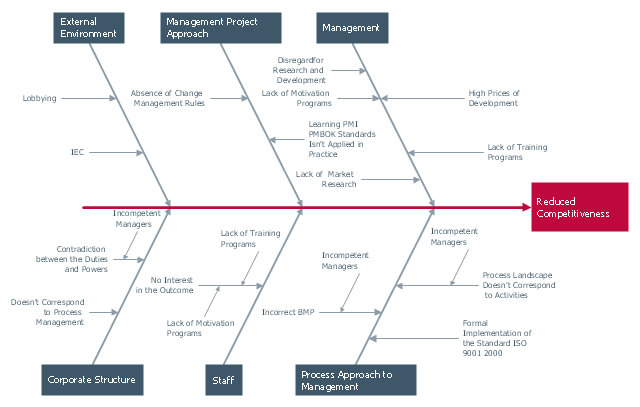
"Cause-and-effect diagrams can reveal key relationships among various variables, and the possible causes provide additional insight into process behavior.
Causes can be derived from brainstorming sessions. These groups can then be labeled as categories of the fishbone. They will typically be one of the traditional categories mentioned above but may be something unique to the application in a specific case. Causes can be traced back to root causes with the 5 Whys technique." [Ishikawa diagram. Wikipedia]
The Ishikawa diagram (cause and effect diagram, fishbone diagram) example "Factors reducing competitiveness" was created using the ConceptDraw PRO diagramming and vector drawing software extended with the Fishbone Diagrams solution from the Management area of ConceptDraw Solution Park.
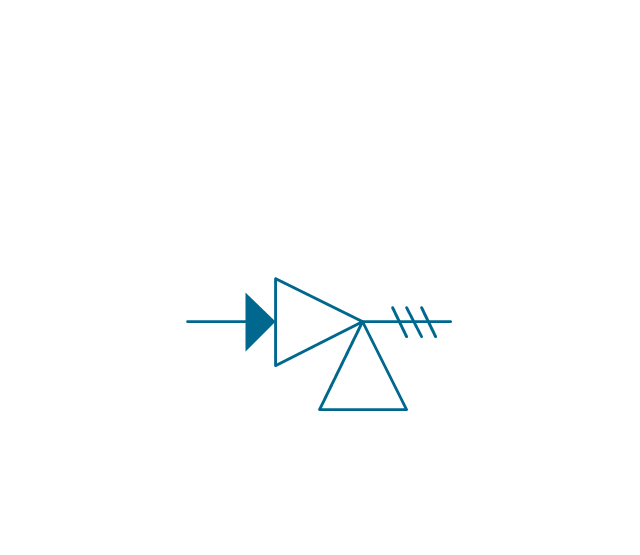
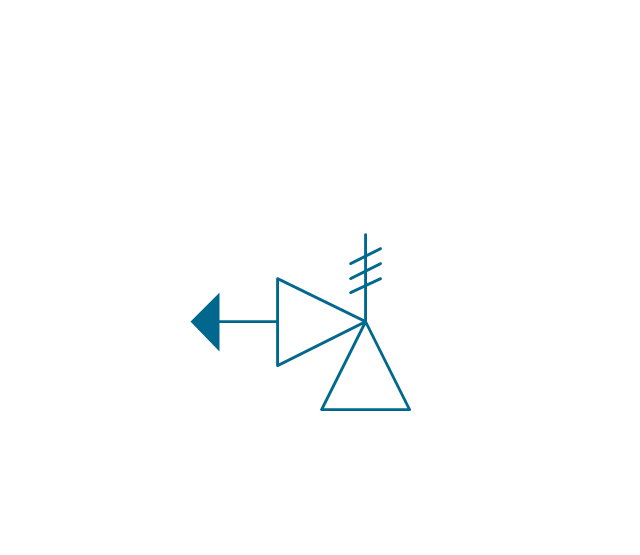
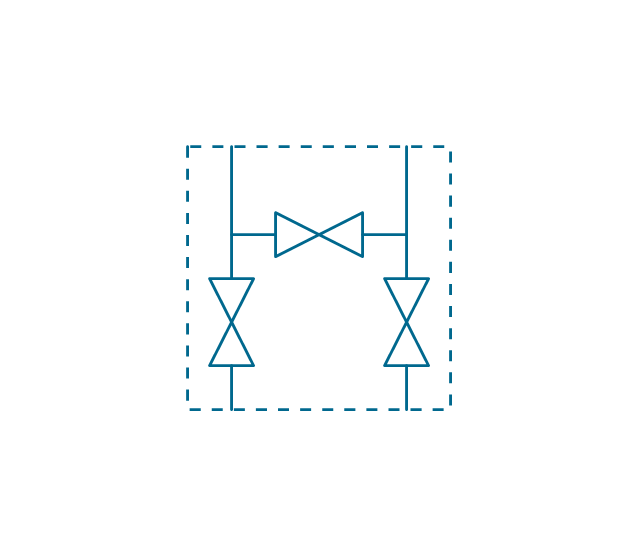
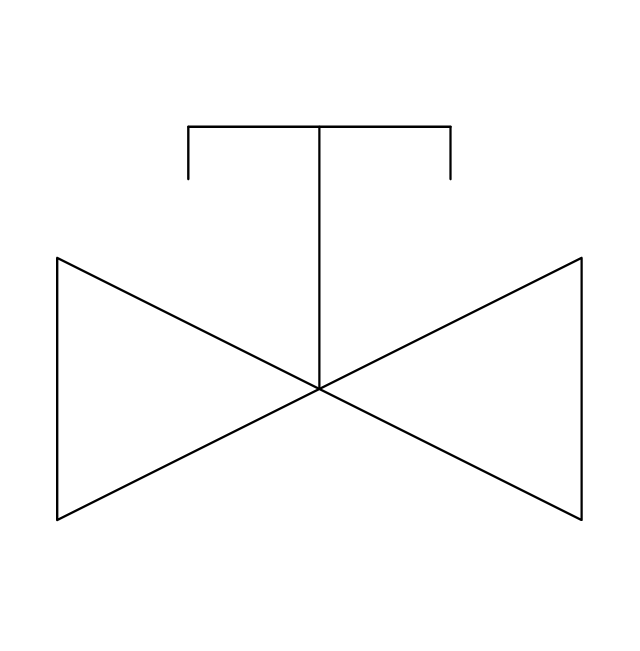
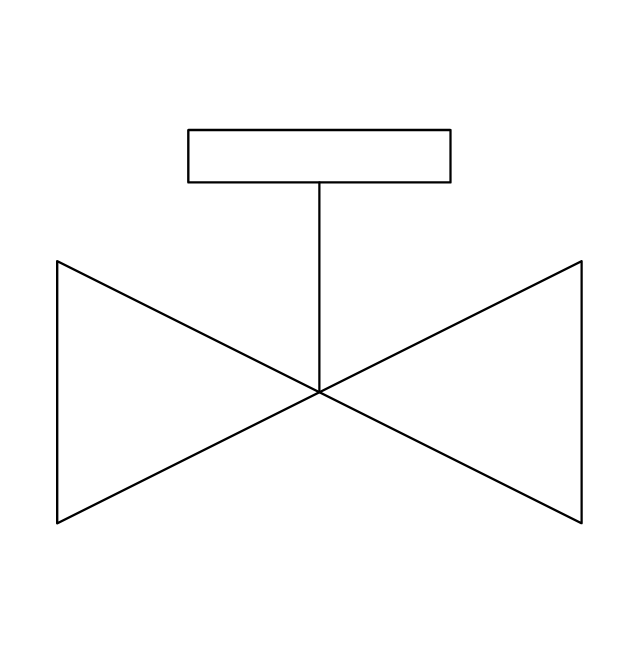
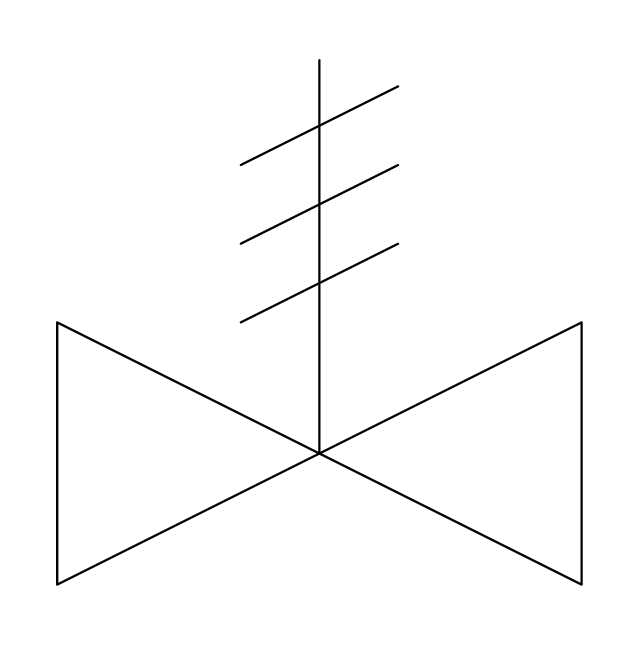
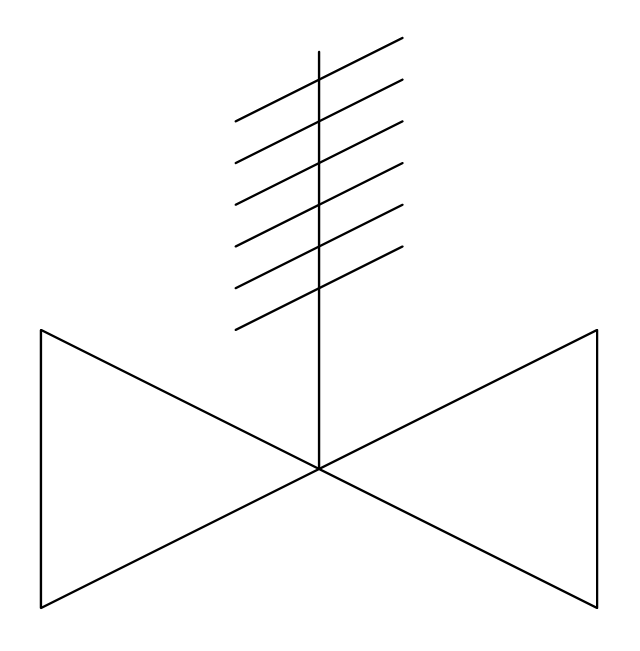
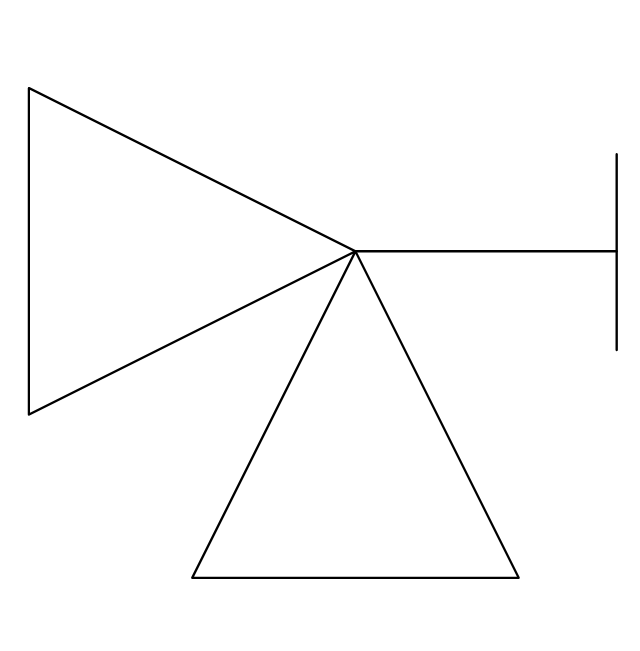
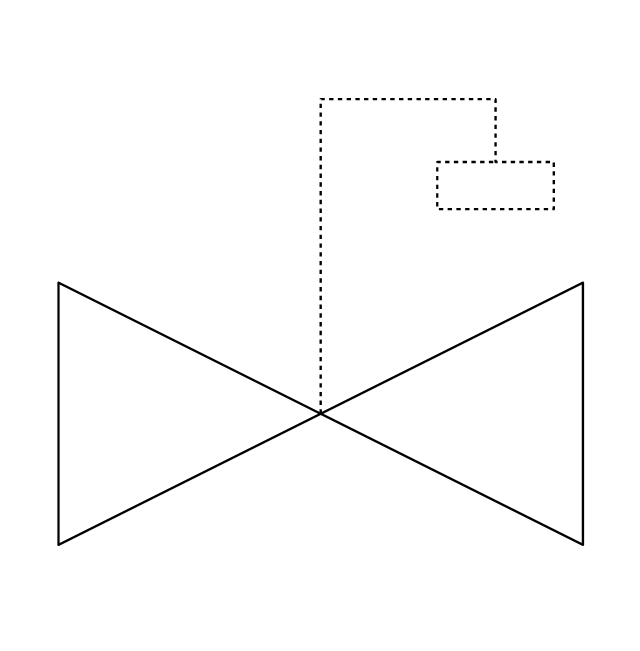
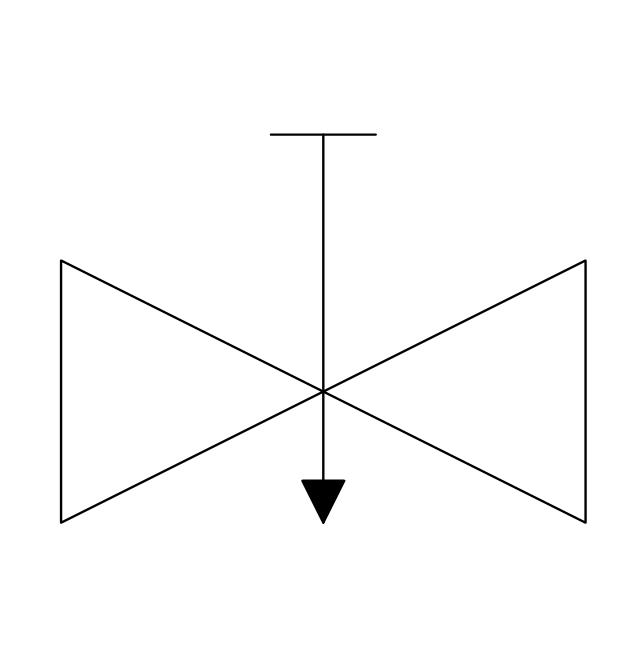
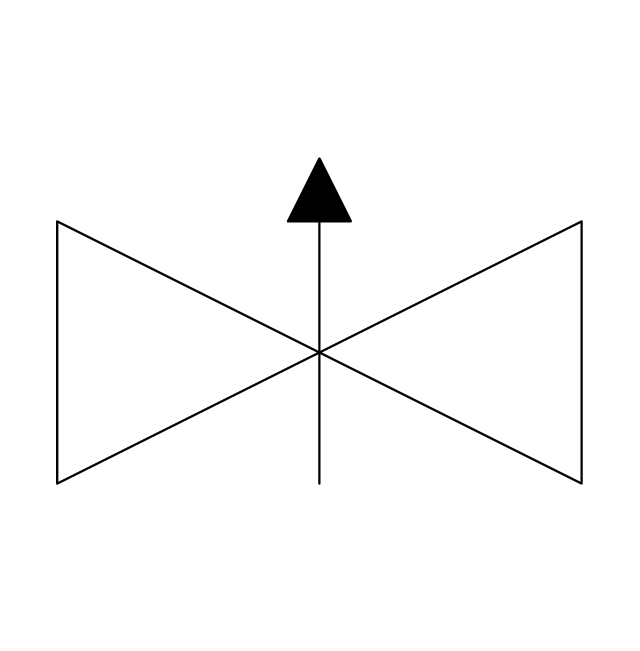
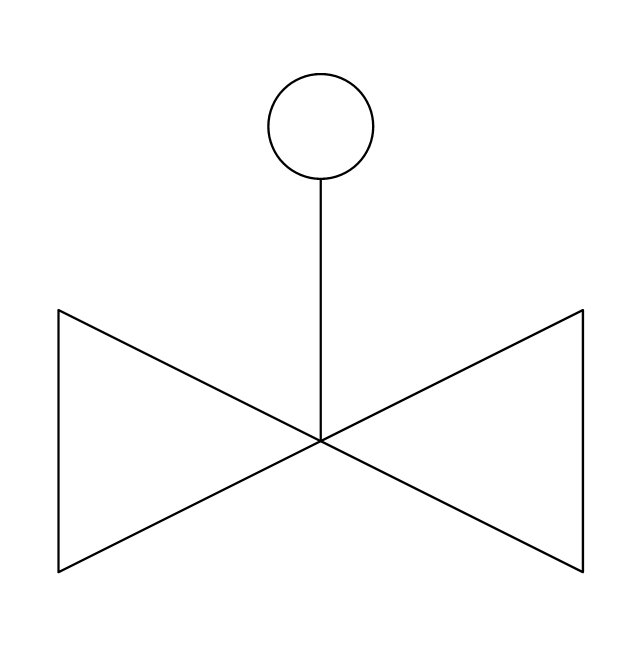
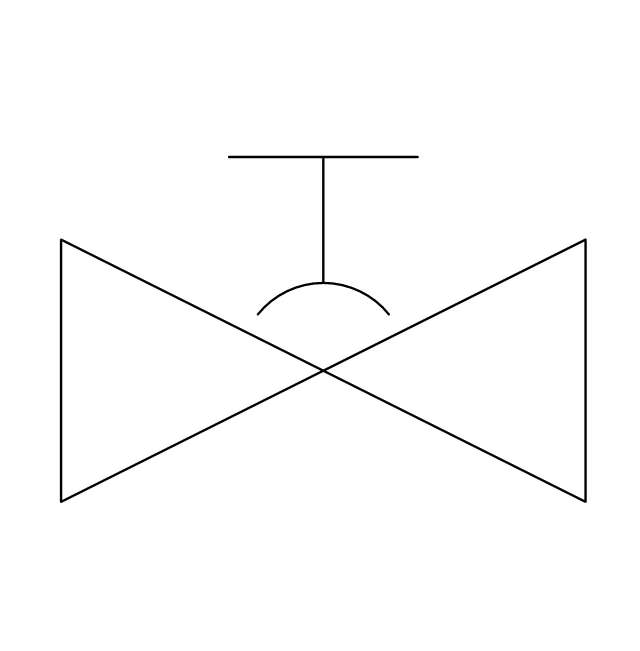
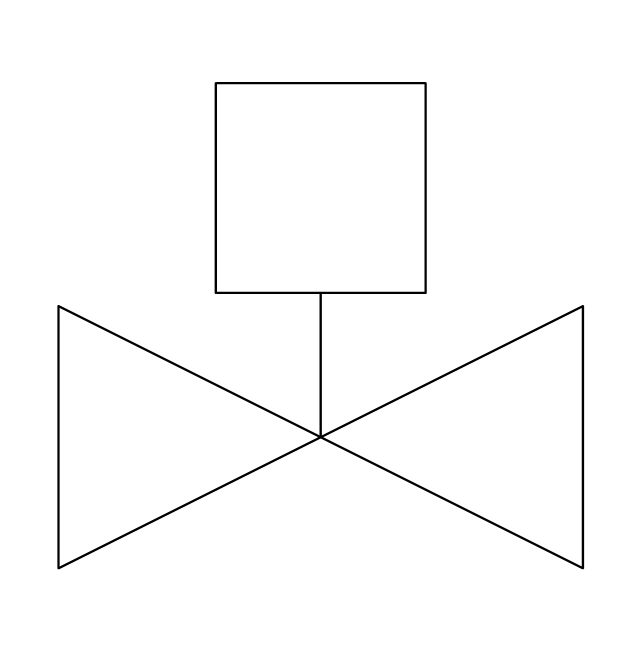
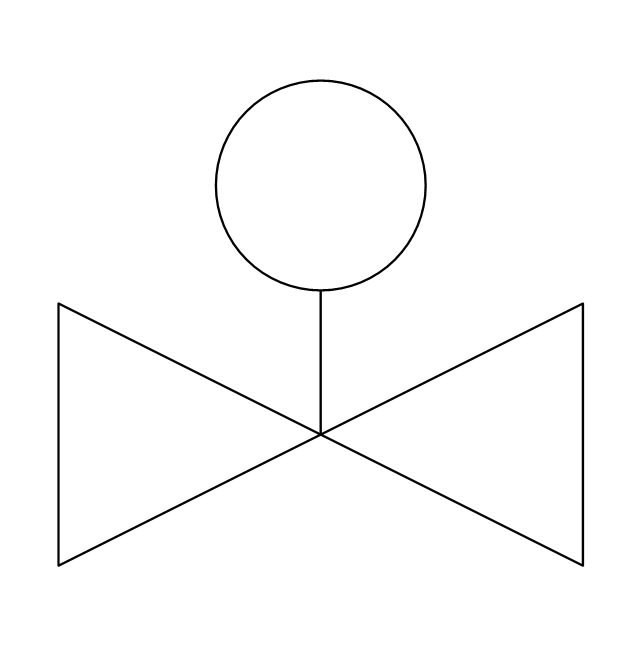
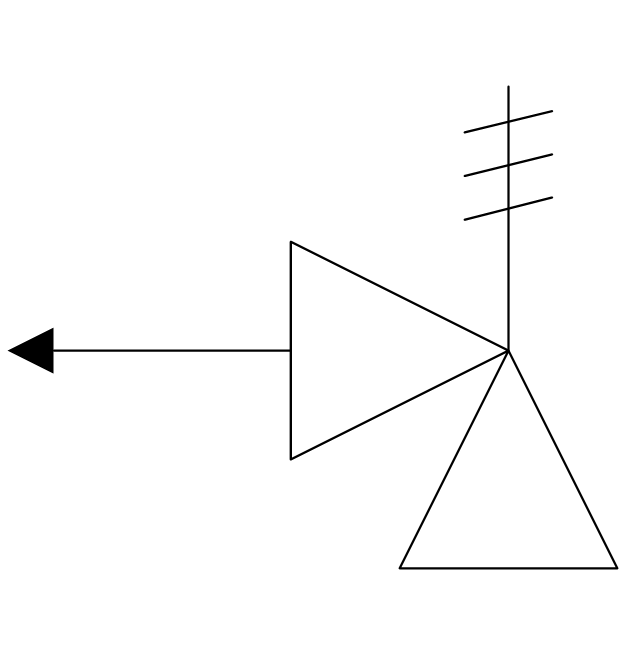
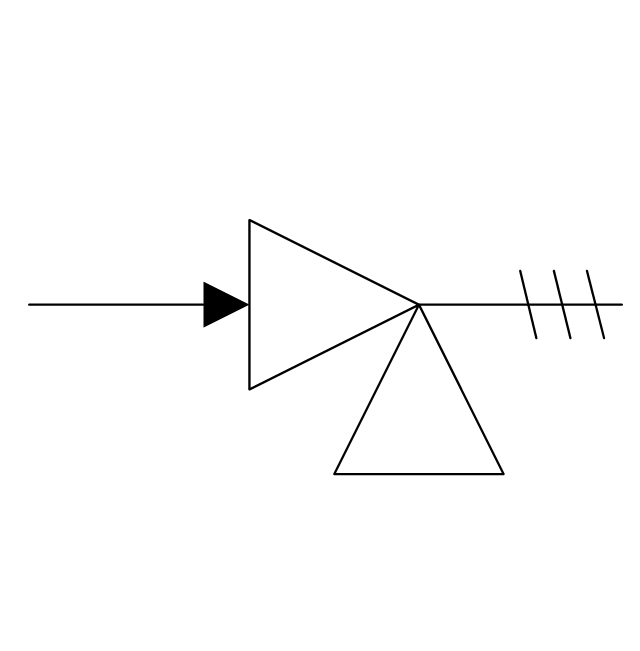
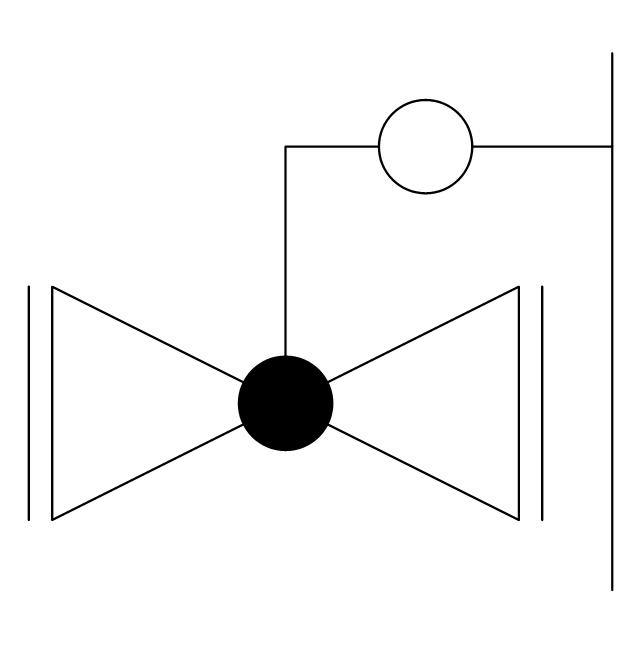
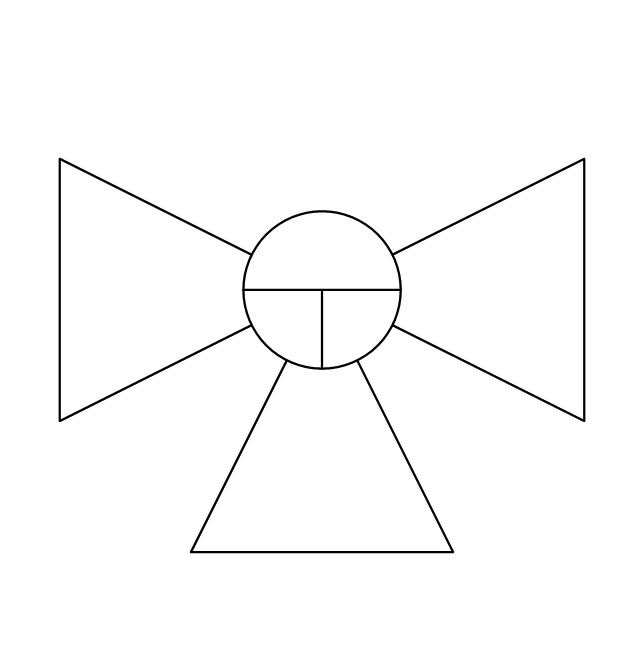
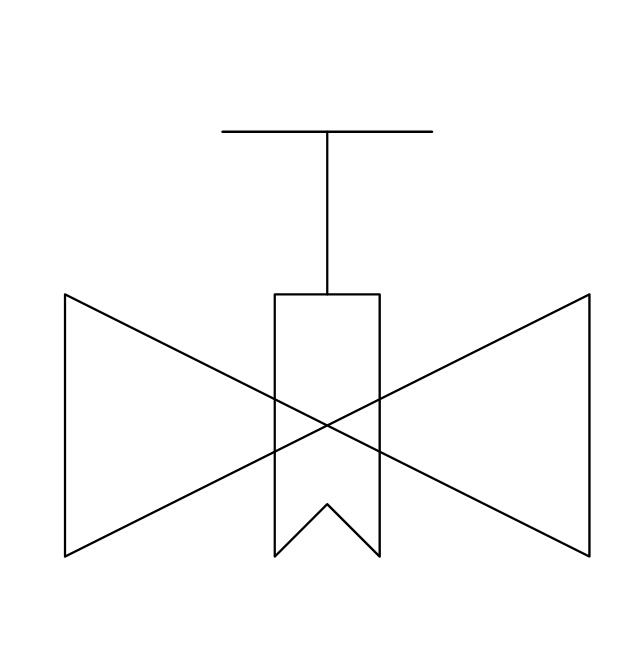
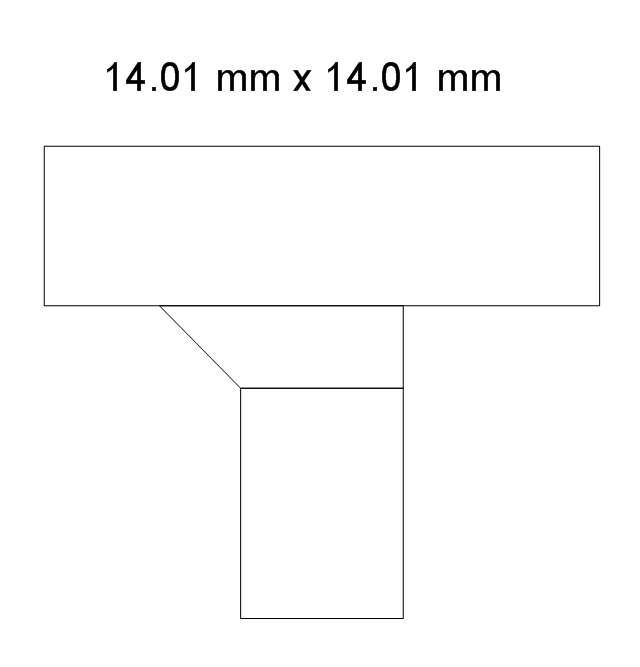
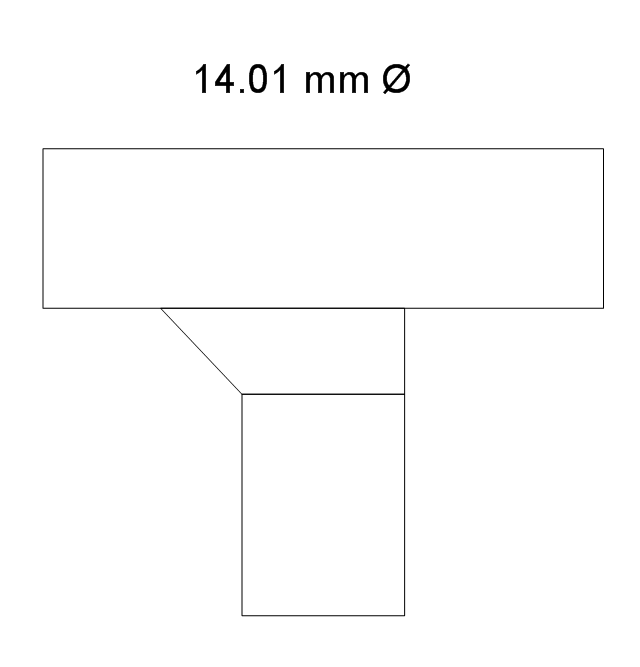
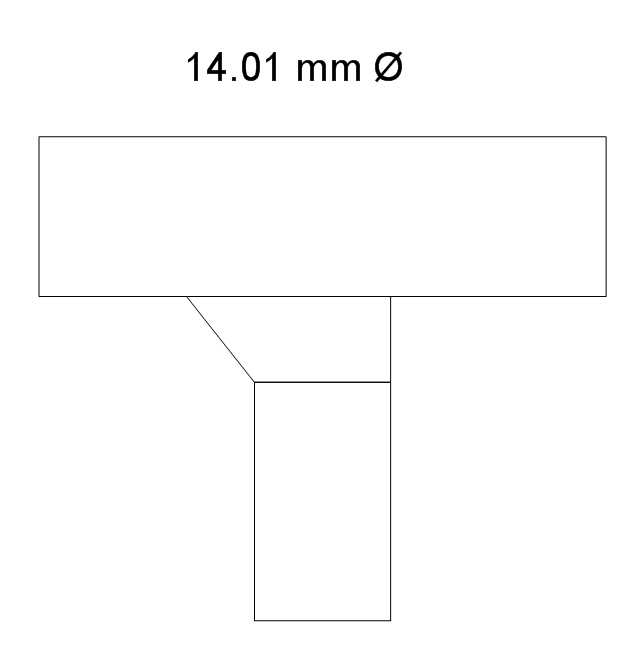
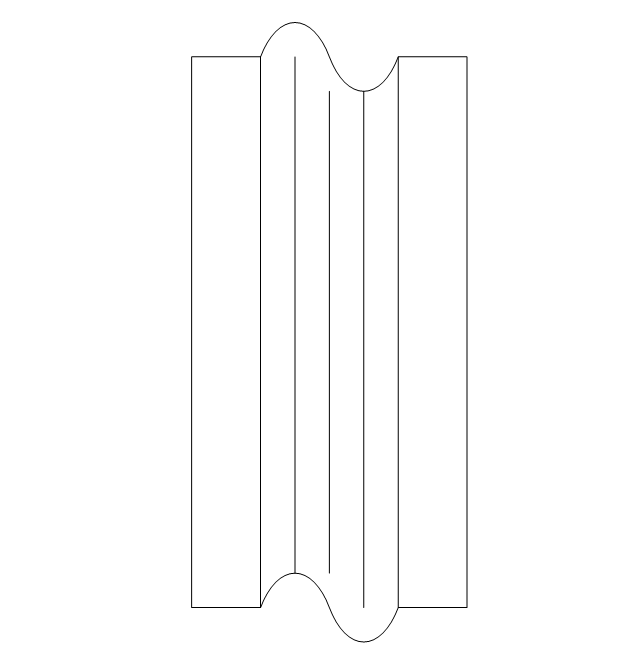
The vector stencils library "Valves and fittings" contains 104 symbols of valve components.
Use these icons for drawing industrial piping systems; process, vacuum, and fluids piping; hydraulics piping; air and gas piping; materials distribution; and liquid transfer systems in the ConceptDraw PRO software extended with the Chemical and Process Engineering solution from the Chemical and Process Engineering area of ConceptDraw Solution Park.
www.conceptdraw.com/ solution-park/ engineering-chemical-process
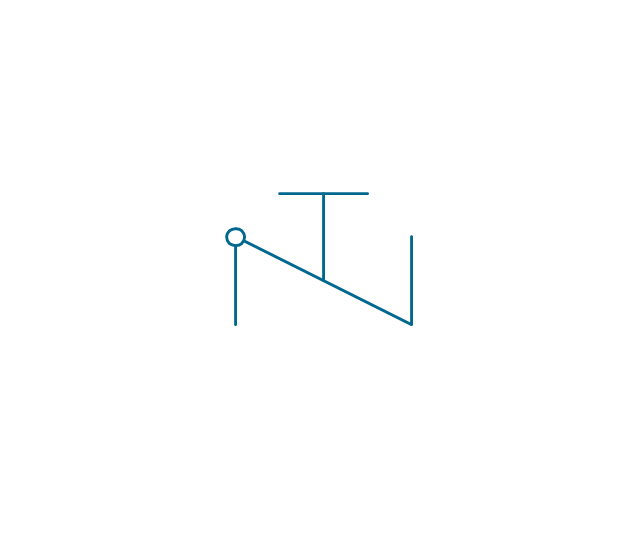
The vector stencils library "Valves" contains 91 symbols of valves. Use it for drawing plumbing and piping plans, schematic diagrams and blueprints of industrial piping systems; process, vacuum, and fluids piping; hydraulics piping; air and gas piping; materials distribution; and liquid transfer systems in the ConceptDraw PRO diagramming and vector drawing software extended with the Plumbing and Piping Plans solution from the Building Plans area of ConceptDraw Solution Park.
How to Dramatically Reduce Drawing Time - New connection modes
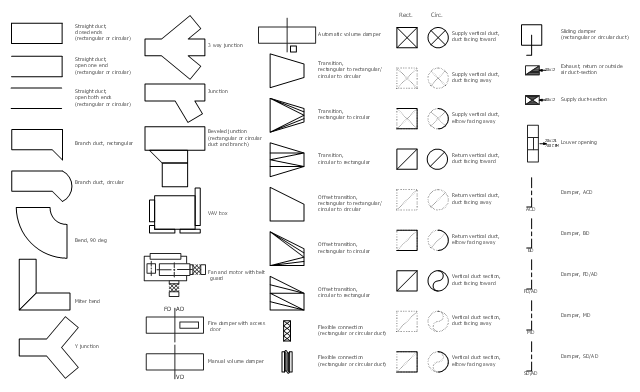
The innovative ConceptDraw Arrows10 Technology included in ConceptDraw PRO is a powerful drawing tool that changes the way diagrams are produced. While making the drawing process easier and faster. This is more than enough versatility to draw any type of diagram with any degree of complexity.The vector stencils library "HVAC ductwork" contains 55 duct and vent symbols of HVAC mechanical components. Use it for drawing HVAC ductwork system diagrams, heating, ventilation, air conditioning, refrigeration, automated building control, and environmental control design in the ConceptDraw PRO diagramming and vector drawing software extended with the HVAC Plans solution from the Building Plans area of ConceptDraw Solution Park.
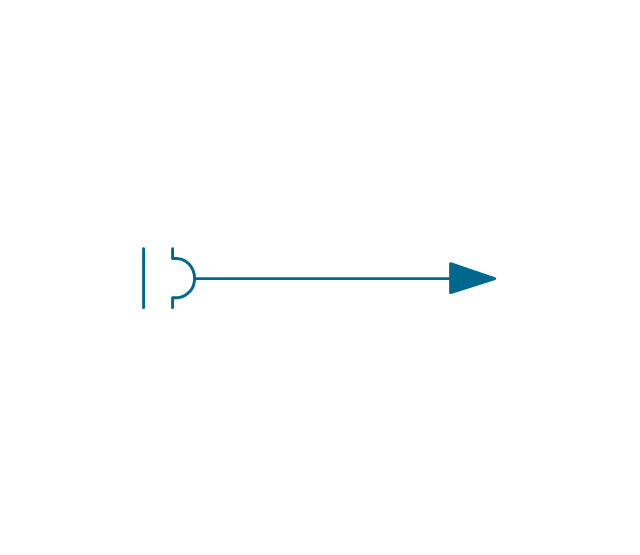
The vector stencils library "Valves" contains 91 symbols of valves. Use it for drawing plumbing and piping plans, schematic diagrams and blueprints of industrial piping systems; process, vacuum, and fluids piping; hydraulics piping; air and gas piping; materials distribution; and liquid transfer systems in the ConceptDraw PRO diagramming and vector drawing software extended with the Plumbing and Piping Plans solution from the Building Plans area of ConceptDraw Solution Park.
"A piping and instrumentation diagram/ drawing (P&ID) is a diagram in the process industry which shows the piping of the process flow together with the installed equipment and instrumentation. ...
P&IDs play a significant role in the maintenance and modification of the process that it describes. It is critical to demonstrate the physical sequence of equipment and systems, as well as how these systems connect. During the design stage, the diagram also provides the basis for the development of system control schemes, allowing for further safety and operational investigations, such as a Hazard Analysis and Operability Study...
For processing facilities, it is a pictorial representation of:
Key piping and instrument details,
Control and shutdown schemes,
Safety and regulatory requirements,
Basic start up and operational information." [Piping and instrumentation diagram. Wikipedia]
The piping and instrumentation diagram template for the ConceptDraw PRO diagramming and vector drawing software is included in the Chemical and Process Engineering solution from the Engineering area of ConceptDraw Solution Park.
The vector stencils library "Citric acid cycle (TCA cycle)" contains 26 symbols of metabolites for drawing metabolic pathway maps and biochemical shematic diagrams of the citric acid cycle (TCA cycle, tricarboxylic acid cycle, Krebs cycle) and diagrams of metabolism processes.
"The citric acid cycle - also known as the tricarboxylic acid cycle (TCA cycle), or the Krebs cycle, - is a series of chemical reactions used by all aerobic organisms to generate energy through the oxidation of acetate derived from carbohydrates, fats and proteins into carbon dioxide and chemical energy in the form of adenosine triphosphate (ATP). In addition, the cycle provides precursors of certain amino acids as well as the reducing agent NADH that is used in numerous other biochemical reactions. Its central importance to many biochemical pathways suggests that it was one of the earliest established components of cellular metabolism and may have originated abiogenically.
The name of this metabolic pathway is derived from citric acid (a type of tricarboxylic acid) that is consumed and then regenerated by this sequence of reactions to complete the cycle. In addition, the cycle consumes acetate (in the form of acetyl-CoA) and water, reduces NAD+ to NADH, and produces carbon dioxide as a waste byproduct. The NADH generated by the TCA cycle is fed into the oxidative phosphorylation (electron transport) pathway. The net result of these two closely linked pathways is the oxidation of nutrients to produce usable chemical energy in the form of ATP." [Citric acid cycle. Wikipedia]
The shapes example "Design elements - TCA cycle" is included in the Biology solution from the Science and Education area of ConceptDraw Solution Park.
The vector stencils library "Valves and fittings" contains 104 symbols of valve components.
Use these icons for drawing industrial piping systems; process, vacuum, and fluids piping; hydraulics piping; air and gas piping; materials distribution; and liquid transfer systems in the ConceptDraw PRO software extended with the Chemical and Process Engineering solution from the Chemical and Process Engineering area of ConceptDraw Solution Park.
www.conceptdraw.com/ solution-park/ engineering-chemical-process
Use these icons for drawing industrial piping systems; process, vacuum, and fluids piping; hydraulics piping; air and gas piping; materials distribution; and liquid transfer systems in the ConceptDraw PRO software extended with the Chemical and Process Engineering solution from the Chemical and Process Engineering area of ConceptDraw Solution Park.
www.conceptdraw.com/ solution-park/ engineering-chemical-process
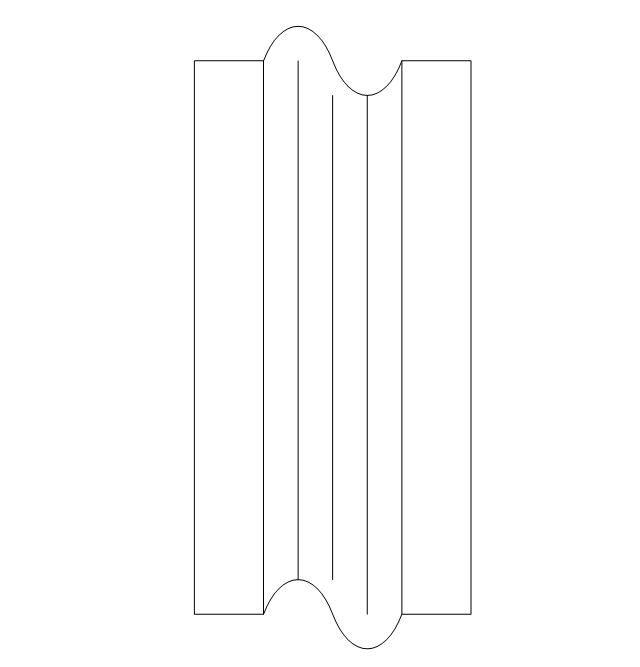
The vector stencils library "HVAC ductwork" contains 55 ducts, vents and HVAC mechanical components symbols.
Use the design elements library "HVAC ductwork" for drawing the HVAC ductwork system diagrams, heating, ventilation, air conditioning, refrigeration, automated building control and environmental control system layout floor plans.
"Ducts are used in heating, ventilation, and air conditioning (HVAC) to deliver and remove air. These needed airflows include, for example, supply air, return air, and exhaust air. Ducts also deliver, most commonly as part of the supply air, ventilation air. As such, air ducts are one method of ensuring acceptable indoor air quality as well as thermal comfort.
A duct system is often called ductwork. Planning ('laying out'), sizing, optimizing, detailing, and finding the pressure losses through a duct system is called duct design." [Duct (HVAC). Wikipedia]
The shapes library "HVAC ductwork" is included in the HVAC Plans solution from the Building Plans area of ConceptDraw Solution Park.
- Ishikawa diagram - Factors reducing competitiveness | Fishbone ...
- Fast food restaurant menu prices | Food infogram - Reducing ...
- Food infogram - Reducing sodium | Activities calendar - FEMA ...
- Food infogram - Reducing sodium | Design elements - Beverages ...
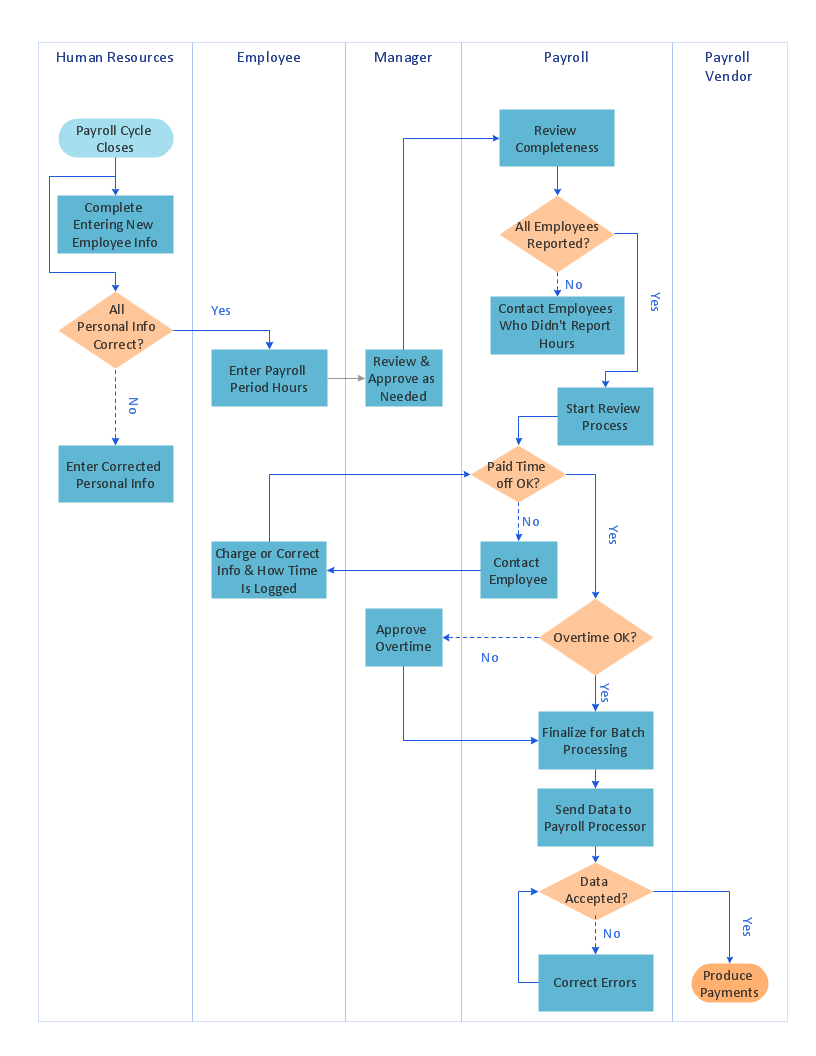
- Cross-Functional Flowchart | Food infogram - Reducing sodium ...
- Food infogram - Reducing sodium | Banquet Hall Plan Software ...
- Food Recipes | Food infogram - Reducing sodium | Fast food ...
- Food infogram - Reducing sodium | Organizational chart - National ...
- Reducing Flange Symbol


































































































































































-piping-and-instrumentation-diagram-template.png--diagram-flowchart-example.png)
-symbols--design-elements---tca-cycle.png--diagram-flowchart-example.png)
