UML Use Case Diagram Example. Registration System
This sample was created in ConceptDraw DIAGRAM diagramming and vector drawing software using the UML Use Case Diagram library of the Rapid UML Solution from the Software Development area of ConceptDraw Solution Park. This sample shows the types of user’s interactions with the system and is used at the registration and working with the database system."A registered user is one who uses a program or a website and provides his/ her credentials, effectively proving his/ her identity. ...
Generally speaking, any person can become a registered user by providing some credentials, usually in the form of a username (or email) and password. After that, one can access information and privileges unavailable to non-registered users, usually referred to simply as guests. The action of providing the proper credentials for a website is called logging in, or signing in." [Registered user. Wikipedia]
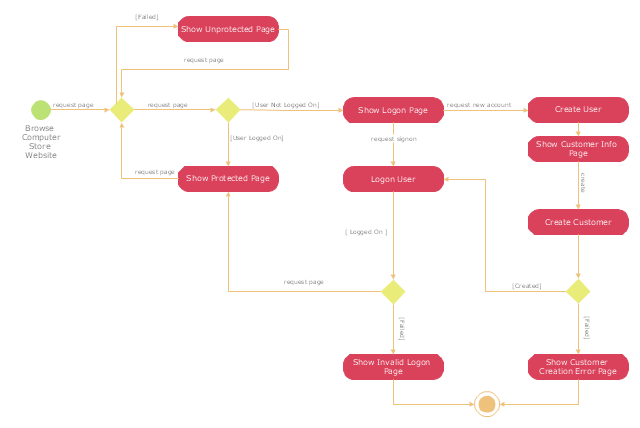
The UML activity diagram example "User registration" was created using the ConceptDraw PRO diagramming and vector drawing software extended with the Rapid UML solution from the Software Development area of ConceptDraw Solution Park.
Business process Flow Chart — Event-Driven Process chain (EPC) diagrams
Event-Driven Process chain Diagrams for improvement throughout an organisation. Best software for Process Flow Diagram. The Event-driven Process Chain (EPC) Diagrams allows managers to plan processes and resources.Diagramming Software for Design UML Activity Diagrams
Activity diagram describes the business and operational step-by-step workflows of components in a system. An activity diagram shows the overall flow of control.
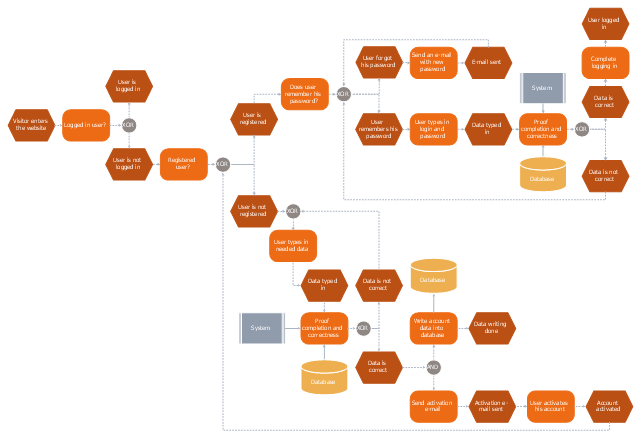
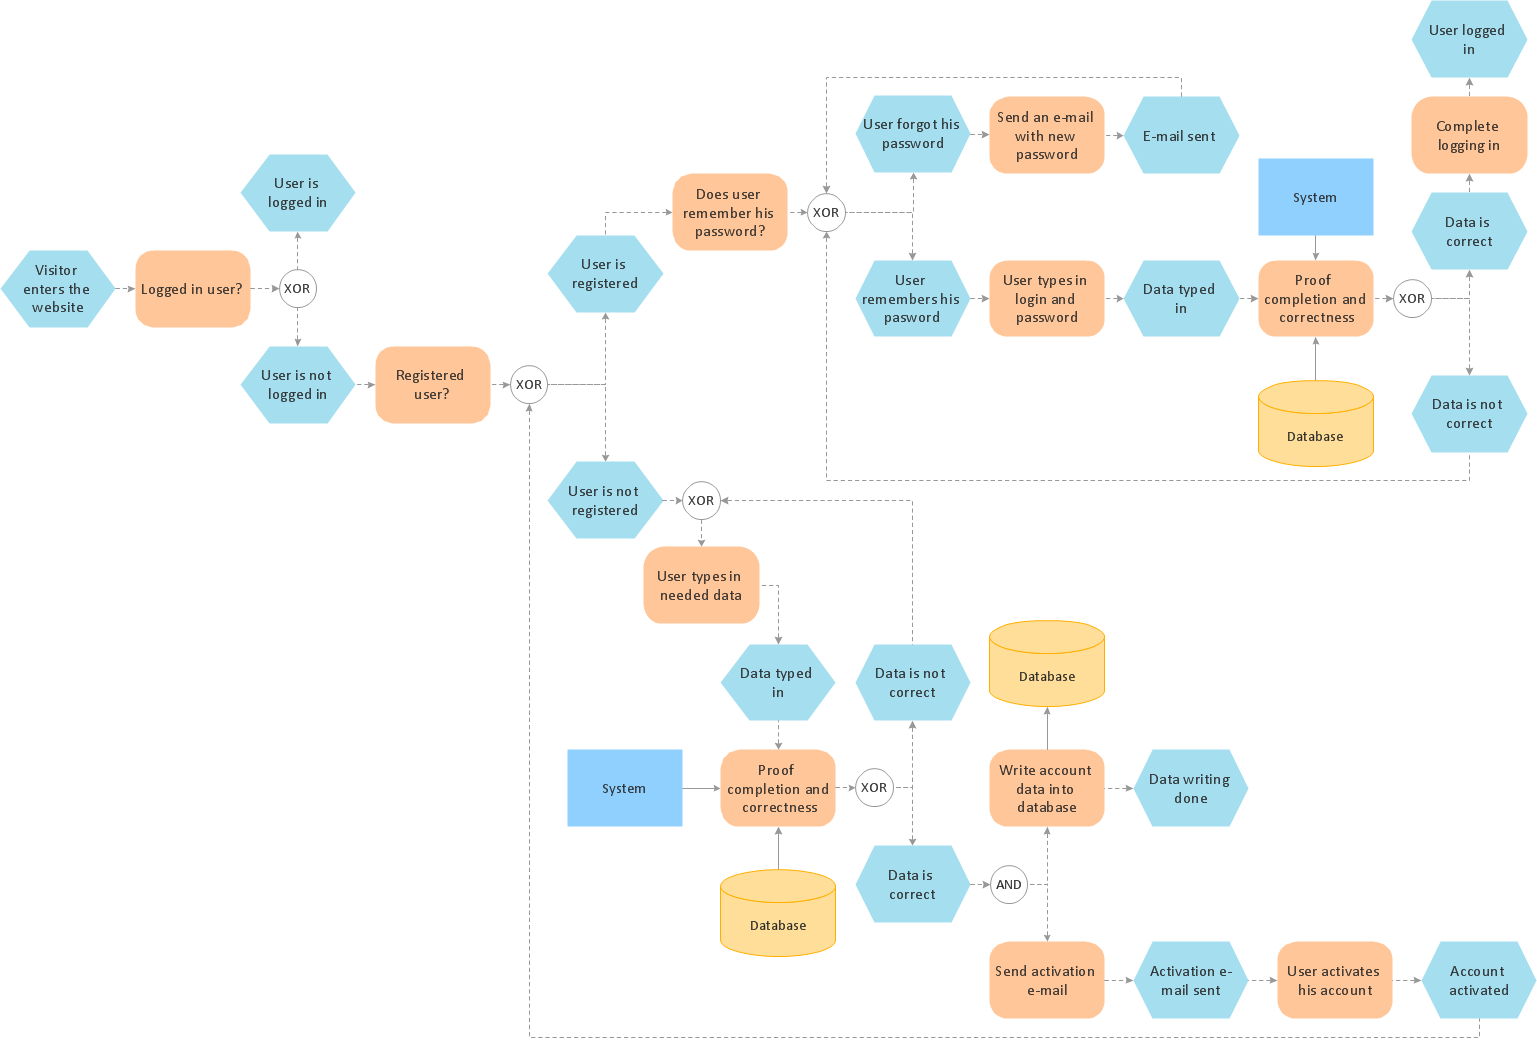
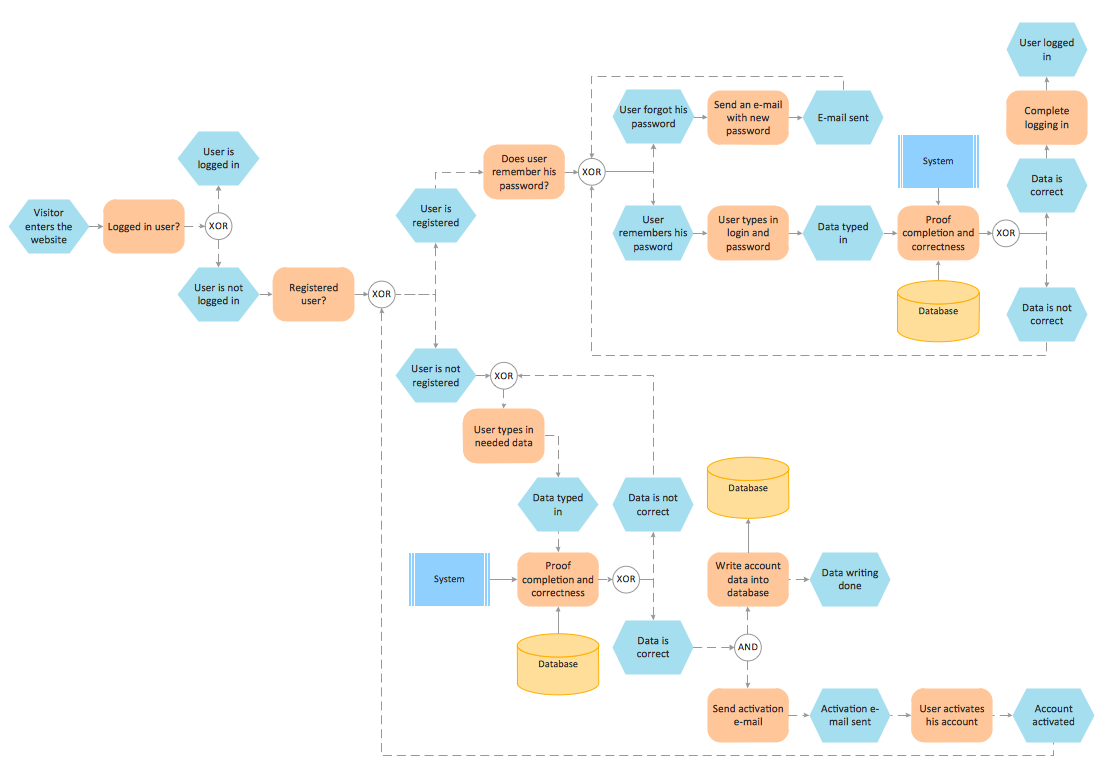
This computer security EPC diagram sample depicts the login and registration processing flow.
"In computer security, a login or logon refers to the credentials required to obtain access to a computer system or other restricted area. Logging in or on and signing in or on is the process by which individual access to a computer system is controlled by identifying and authenticating the user through the credentials presented by the user.
Once a user has logged in, they can then log out or log off when access is no longer needed. To log out is to close off one's access to a computer system after having previously logged in." [Login. Wikipedia]
The event-driven process chain (EPC) flowchart example "Login and registration processing" was created using the ConceptDraw PRO diagramming and vector drawing software extended with the Event-driven Process Chain Diagrams solution from the Business Processes area of ConceptDraw Solution Park.
EPC (Event-driven Process Chain) Flowcharts
The Event - driven Process Chain ( EPC ) allows managers visually present business process models for making decisions for business processes improvement. Event-Driven Process Сhain Diagrams for improvement throughout an organisation.Process Modelling using Event-driven Process chain
Event-Driven Process Chain Diagrams for improvement throughout an organisation. ConceptDraw DIAGRAM - business process mapping software that reduces the time needed to create a business process model and its excellent business process improvement tools.Flowchart
The Flowcharts are widespread in various fields and include the multitude of types. They are dedicated to representation the algorithms, processes, workflows of any complexity in a clear and intuitive format. The Flowcharts are commonly used in software development as a visual tool for illustration algorithms and logic of computer programs, in business for illustration business scenarios, in education, and so on. For drawing the Flowchart are used the special object blocks, among them rectangle or box used to represent an activity or step, rounded box or oval to depict Start / End, diamond to represent the decision point (involves the branching yes/no), circle used to represent the point of connection, parallelogram to represent the Input / Output, and some others. With ConceptDraw DIAGRAM including Flowcharts solution it is easy to create professional-looking Flowchart diagrams of any complexity and any degree of detailing. Succeed in drawing the Flowcharts using quick-start templates, predesigned samples and extensive libraries of ready-made flowchart symbols, blocks and icons.Formalization and Verification of Event-driven Process chain
EPC or The Event - driven Process Chain diagrams that provide Enterprise Resource Planning improvement. ConceptDraw DIAGRAM - software that reduces the time needed to create a business process model.Form Maker
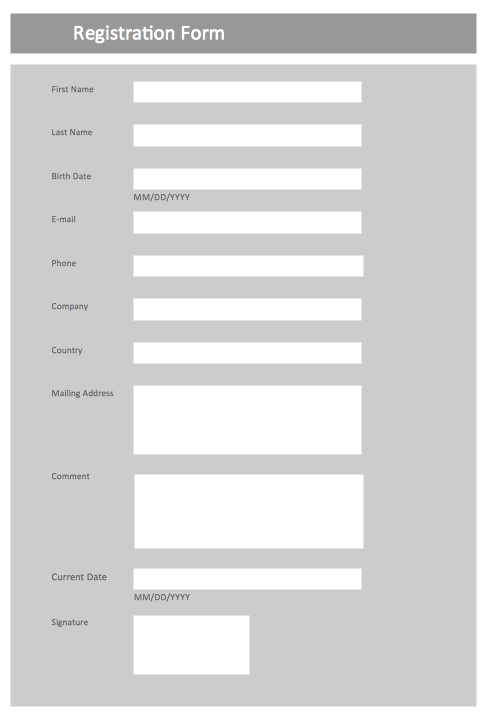
Use the Basic Diagramming Solution from the Universal Diagramming area of ConceptDraw Solution Park to easy create simple forms, questionnaires, survey forms, registration and application forms, etc.The Best Tool for Business Process Modeling
The EPC diagram shows various business processes in terms of work flows. Event-Driven Process chain Diagrams for improvement throughout an organisation. ConceptDraw DIAGRAM - business process mapping software that reduces the time needed to create a business process model and is excellent business process improvement tools.Diagramming Software for Design UML Use Case Diagrams
Use Case Diagrams describes the functionality provided by a system in terms of actors, their goals represented as use cases, and any dependencies among those use cases.
UML Class Diagram. Design Elements
UML Class Diagrams describes the structure of a system by showing the system's classes, their attributes, and the relationships among the classes.UML Diagram Types List
Two types of diagrams are used in UML: Structure Diagrams and Behavior Diagrams. Behavior Diagrams represent the processes proceeding in a modeled environment. Structure Diagrams represent the elements that compose the system.Interaction Overview Diagram
UML Interaction Overview Diagram schematically shows a control flow with nodes and a sequence of activities that can contain interaction or sequence diagrams.
- UML Use Case Diagram Example Registration System | UML activity ...
- UML activity diagram - User registration | Diagramming Software for ...
- Flowchart | UML Use Case Diagram Example Registration System ...
- UML Use Case Diagram Example Registration System | Financial ...
- UML Use Case Diagram Example Registration System ...
- UML Use Case Diagram Example Registration System | UML ...
- Activity Diagram For Member Registration In Library System
- UML activity diagram - User registration | UML Use Case Diagram ...
- UML Use Case Diagram Example Registration System
- UML Use Case Diagram Example Registration System | UML Class ...
- UML Use Case Diagram Example Registration System
- UML Use Case Diagram Example Registration System | UML ...
- UML Use Case Diagram Example Registration System | UML Class ...
- UML Use Case Diagram Example Registration System | Jacobson ...
- Use Case Diagram For Exam Registration System
- UML Use Case Diagram Example Registration System | UML ...
- Login and registration processing - EPC diagram | Flowchart ...
- UML Use Case Diagram Example Registration System | UML ...
- UML activity diagram - User registration
- UML Use Case Diagram Example Registration System | Taxi ...

