HelpDesk
How To Create the Interaction (Relation) Diagram
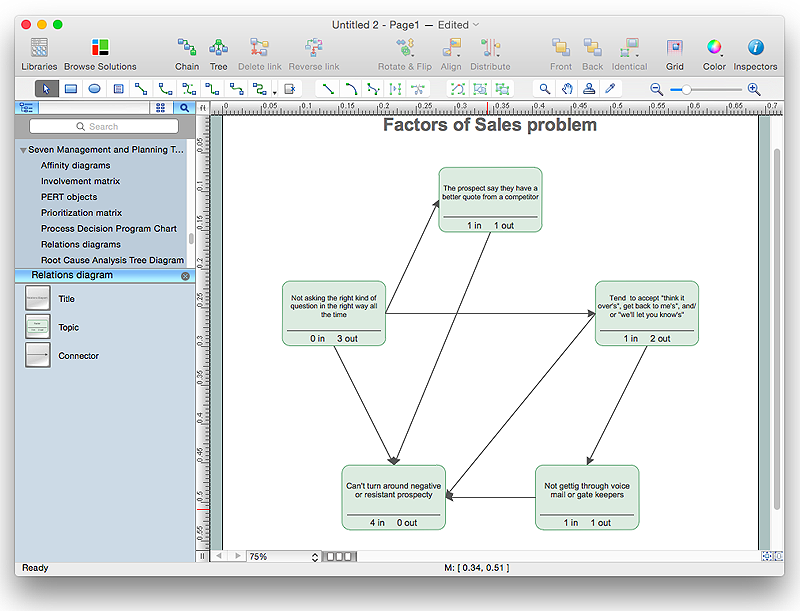
Identify relationships between factors affecting a problem using interaction (relation) diagram. The ability to create a Relation diagram from a mind map is supported by the ConceptDraw Seven Management and Planning Tools solution.
 ConceptDraw Solution Park
ConceptDraw Solution Park collects graphic extensions, examples and learning materials
 Entity-Relationship Diagram (ERD)
Entity-Relationship Diagram (ERD) solution extends ConceptDraw PRO software with templates, samples and libraries of vector stencils from drawing the ER-diagrams by Chen's and crow’s foot notations.
 Management Area
The solutions from Management area of ConceptDraw Solution Park collect templates, samples and libraries of vector stencils for drawing the management diagrams and mind maps.
 PM Easy
This solution extends ConceptDraw PROJECT software with the ability to quickly start a project; it lists task relationships and dependencies to make iterative planning easy.
 Seven Management and Planning Tools
Seven Management and Planning Tools solution extends ConceptDraw PRO and ConceptDraw MINDMAP with features, templates, samples and libraries of vector stencils for drawing management mind maps and diagrams.
HelpDesk
How to Draw a Pictorial Chart in ConceptDraw PRO
Pictorial Infographics is used to visually present data comparison. Pictorial charts use relative sizes or repetitions of the same icon, picture, or symbol to show data relation. Using a Pictorial chart to show business data patterns and trends will add much more efficiency to your business communications. Finding the right tool for the job can sometimes be tricky. Developing sophisticated and effective infographics can require toolsthat may span many different products. Fortunately, ConceptDraw PRO has everything you need to create polished Pictorial Infographics that beautifully and accurately represent your story, no matter how complex it may be.HelpDesk
How to Create a Venn Diagram in ConceptDraw PRO
Venn diagrams were invented by John Venn as a method of depicting relationships between different components. A Venn diagram consists of two or more circles. Each circle represents a specific group or set. The entities which are depicted by circles generally have some common characteristics. A Venn Diagram shows all the possible logical relations between these entities. Any properties that belong to more than one set should be indicated in the sections where the circles overlap. A Venn Diagram can be useful to visually summarize the status and future viability of a project. ConceptDraw PRO allows you to make a Venn diagrams using the Venn Diagrams solution.HelpDesk
How to Create a Map Depicting the United Kingdom Counties and Regions
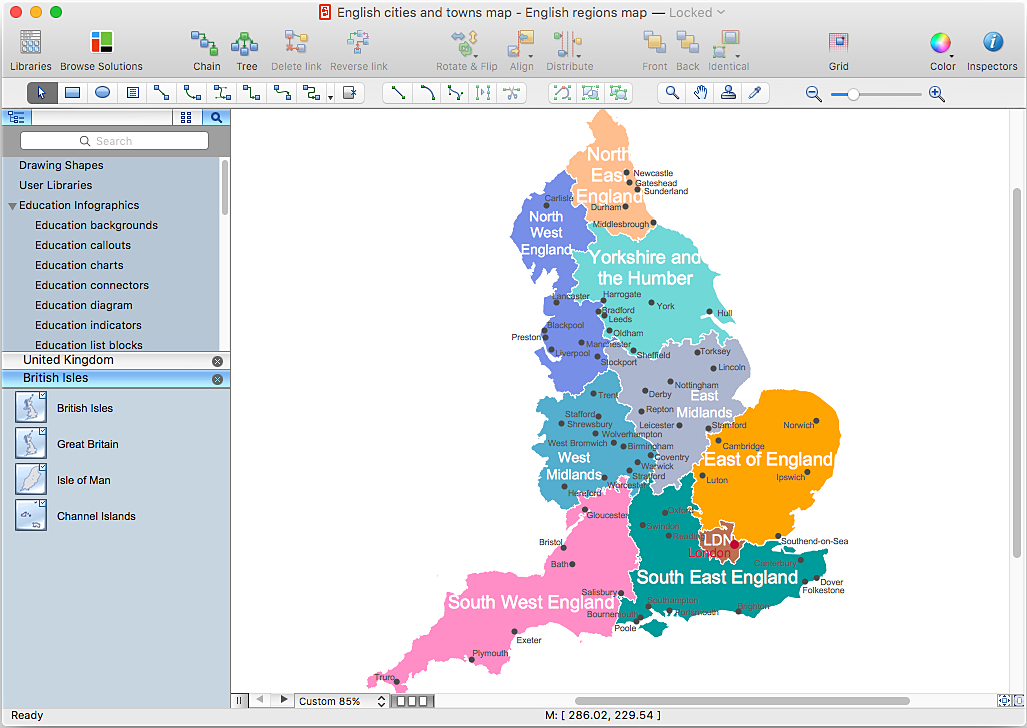
The UK Map Solution for ConceptDraw PRO includes all of the UK counties with county outlined borders, from the largest, North Yorkshire, to the smallest Rutlandshire. Geographical thematic maps are used to visualize information on a number of subjects related with certain geographical location . It is a common way of representing any form of spatial data in relation to a specific geographical area. The UK Map Solution for ConceptDraw PRO includes all of the United Kingdom counties with county outlined borders and major cities. You can quickly create geographic maps, cartograms, and thematic maps for geographical visualization information for business and travels.HelpDesk
How to Draw Maps of Australia Using ConceptDraw PRO
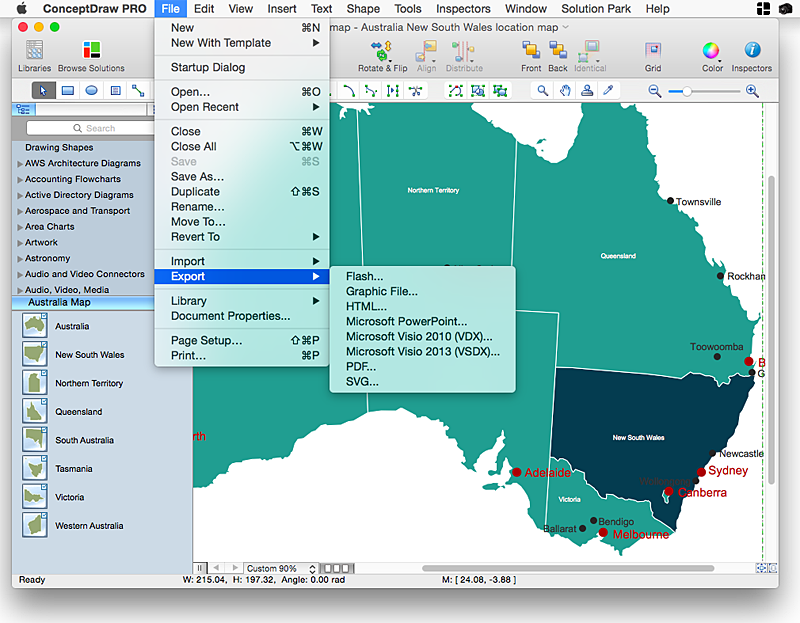
Australia is the sixth largest country in the world. Australia consists from the mainland which is surrounded by many thousands of small fringing islands and numerous larger ones. The vast territories, aligned with interesting historic features across a wide expanse, make the thematic map an ideal way of depicting geographical, geological and political information related to Australia.The Australia Map solution for ConceptDraw PRO will help you to make the steps of the creativeness easy and intuitive. The Australia Map solution provides templates and samples along with vector stencils to get you started. Used together with other ConceptDraw PRO solutions it will allow you to create comprehensive geography-related infographics.HelpDesk
How to Create a Map of Germany Using ConceptDraw PRO
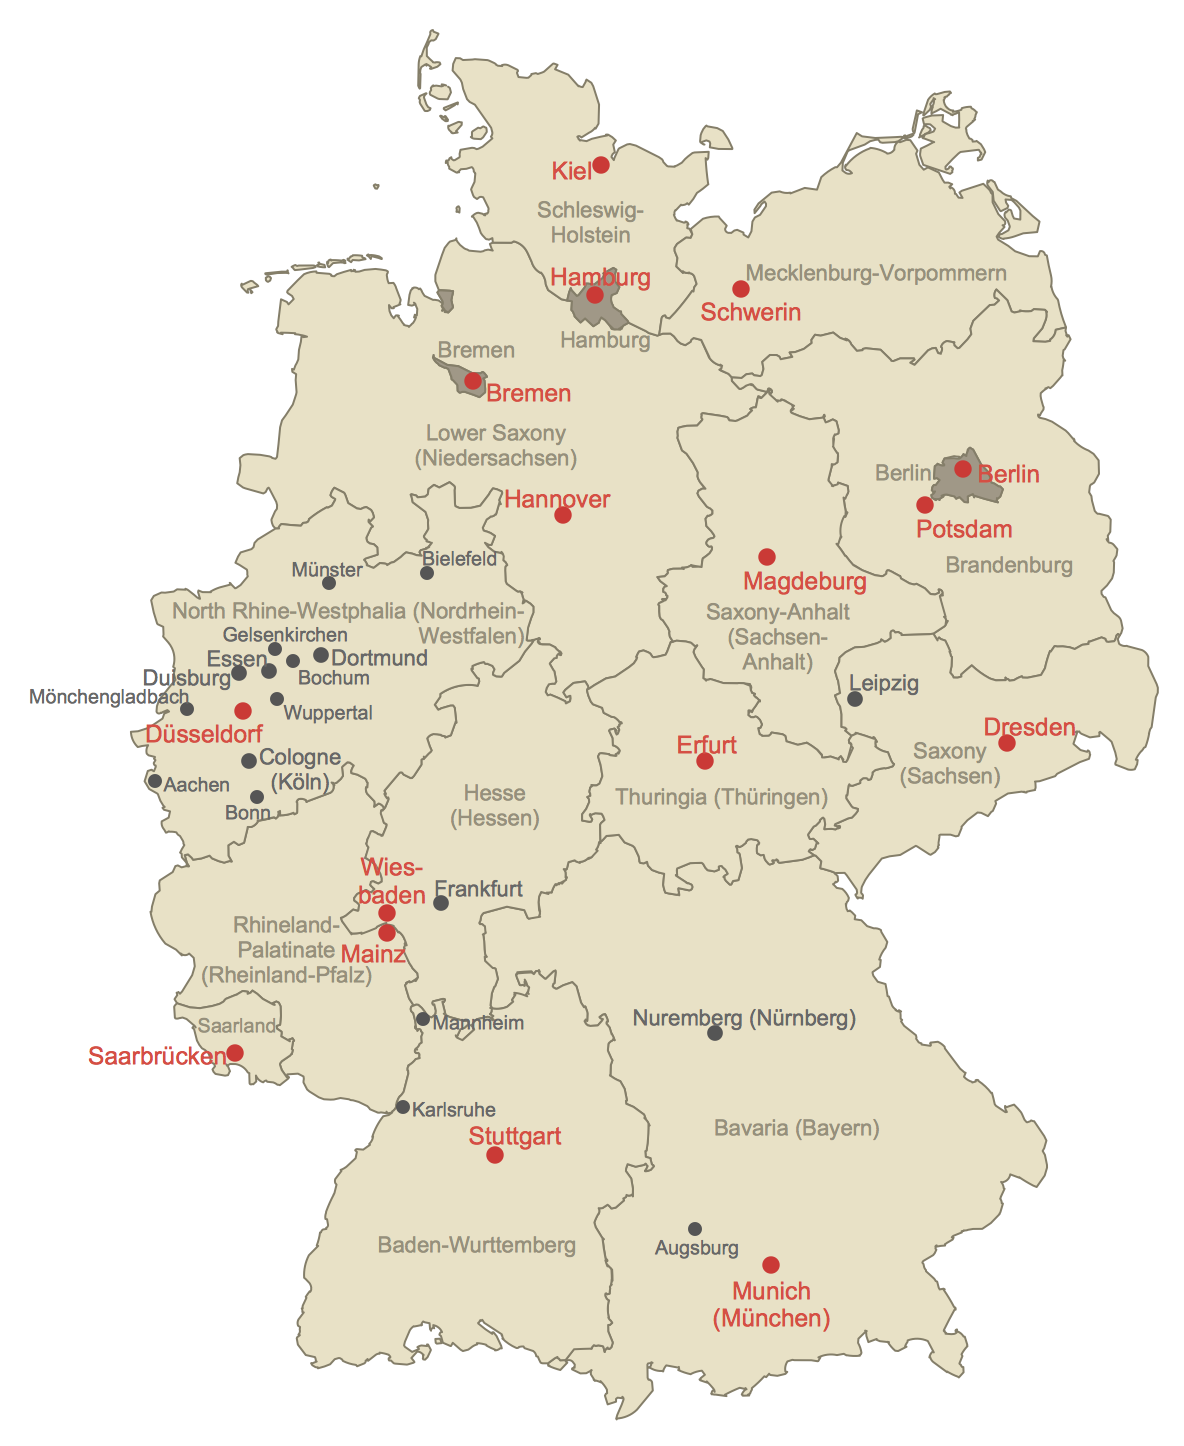
Geographical thematic maps are used to display information on a variety of subjects. It is a common way of representing any form of spatial data in relation to a specific geographical area. The Germany Map Solution for ConceptDraw PRO includes all of the German federal states with county outlined borders and major cities. You can quickly create geographic maps, cartograms, and thematic maps for geographical visualization information for business and travels.
 Venn Diagrams
Venn Diagrams are actively used to illustrate simple set relationships in set theory and probability theory, logic and statistics, mathematics and computer science, linguistics, sociology, and marketing. Venn Diagrams are also often used to visually summarize the status and future viability of a project.
 Seven Management and Planning Tools
Seven Management and Planning Tools solution extends ConceptDraw PRO and ConceptDraw MINDMAP with features, templates, samples and libraries of vector stencils for drawing management mind maps and diagrams.
 Workflow Diagrams
Workflow Diagrams solution extends ConceptDraw PRO software with samples, templates and vector stencils library for drawing the work process flowcharts.
- SWOT analysis for a small independent bookstore | Entity ...
- PM Agile | SWOT Analysis | SWOT analysis Software & Template for ...
- Marketing | How to Share Mind Maps via Internet | What is SWOT ...
- SWOT Analysis Tool for Small Business | Total Quality Management ...
- SWOT analysis matrix diagram templates
- Relationship Matrix Example
- Porter's value chain matrix diagram | SWOT and TOWS Matrix ...
- SWOT analysis for a small independent bookstore | SWOT Analysis ...
- Matrices | Ansoff's product / market matrix | SWOT matrix template ...
- Software for Creating SWOT Analysis Diagrams | Seven ...
- Entity- Relationship Diagram (ERD) | Erd Diagram Of Shoe Company
- SWOT Matrix Template | Matrices | How To Create an Involvement ...
- Decision Making | PROBLEM ANALYSIS. Prioritization Matrix ...
- Authority Matrix Diagram Software | Porter's value chain matrix ...
- Fishbone Diagram | Entity- Relationship Diagram (ERD) | Fault Tree ...
- Entity- Relationship Diagram (ERD) | Er Diagram For Bookstore ...
- Matrices | Seven Management and Planning Tools | Software for ...
- Relationship Analysis Matrix
- Strategic planning cycle - Arrow loop diagram | Strategic planning ...


