HelpDesk
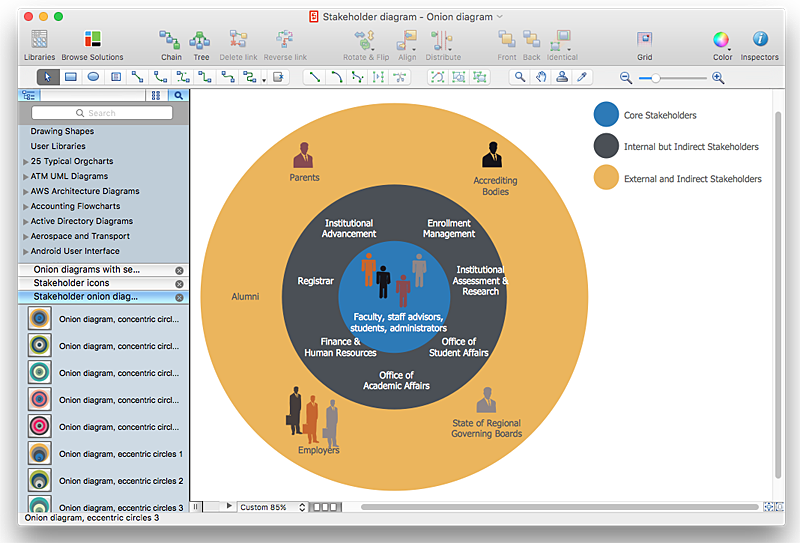
How to Create a Stakeholder Onion Diagram Using ConceptDraw PRO
The Stakeholder Onion Diagram is stakeholder analysis tool from the arsenal of project management. It is used to display the relationships of stakeholders to a project goal. An Onion Diagram shows how the stakeholder activities affect the project results. The ConceptDraw Stakeholder Onion Diagram solution is intended to depict how the relationships that subsists in a project environment can influence on a project. A set of libraries and objects provided by this solution make ashort work of visualizing the stakeholder analysis of a project.HelpDesk
How to Create a Fishbone (Ishikawa) Diagram Quickly
A Fishbone (Ishikawa) diagram is also called cause-and-effect diagram. Fishbone diagram is often used in business to determine the cause of some problem. The diagram illustrates the main causes and sub-causes leading to an event. The main goal of the Fishbone diagram is to illustrate in a graphical way the relationship between a given outcome and all the factors that influence this outcome. The complete diagram resembles a fish skeleton as its name implies. The ability to create a Fishbone Diagram is supported by the Fishbone Diagram solution. Use ConceptDraw MINDMAP for structuring data and then ConceptDraw PRO for generating a Fishbone Diagram from mind map structure.Bio Flowchart Lite
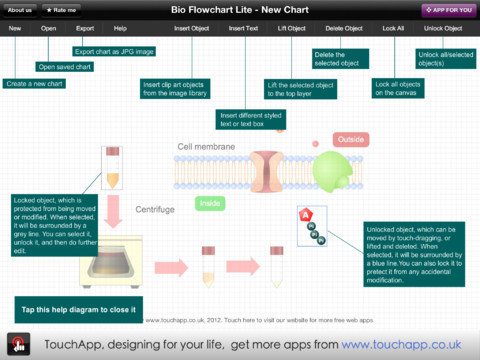
This app targets to help teachers and students to create vivid and professional biological flowcharts and diagrams in an easy way.HelpDesk
How to Draw a Fishbone Diagram with ConceptDraw PRO
Fishbone (Ishikawa) Diagram is often used in business to determine the cause of some problem. A Fishbone diagram is also called cause-and-effect diagram.The main goal of the Fishbone diagram is to illustrate in a graphical way the relationship between a given outcome and all the factors that influence this outcome. The complete diagram resembles a fish skeleton as its name implies. Cause and Effect analysis is used in management to identify the possible causes of a problem in order to eliminate them. The ability to create a Fishbone Diagram is supported by the Fishbone Diagram solution.- Marketing Plan Infographic | HVAC Marketing Plan | Marketing plan ...
- Diagram Of Relationship Marketing
- Marketing Diagrams | Marketing Charts | Marketing Organization ...
- Marketing Analysis Diagram | Flowchart Example: Flow Chart of ...
- Six Markets Model Chart | Marketing Plan Infographic | Business ...
- Best Diagramming | Social strategy - Pyramid diagram | Marketing ...
- Marketing Plan Infographic | Flowchart Marketing Process. Flowchart ...
- Marketing Plan Infographic | Marketing Analysis Diagram | Flowchart ...
- Market value - Pyramid diagram | Six Markets Model Chart | Target ...
- Marketing Diagrams | Marketing mix - Wheel diagram | Venn ...
- Marketing Strategies Examples
- Social strategy - Pyramid diagram | Pyramid Chart Examples ...
- Process Flowchart | Entity- Relationship Diagram (ERD) | Flow chart ...
- Process Flowchart | Marketing Plan Infographic | SWOT Analysis ...
- Gant Chart in Project Management | SWOT analysis matrix diagram ...
- Sample Of Marketing Strategy Flowchart
- Block diagram - Six markets model | Process Flowchart ...
- Block diagram - Six markets model
- Market value - Pyramid diagram | Circle-spoke diagram - Target ...
- Block diagram - Six markets model | Visualize Stakeholder Analysis ...


