 Pie Charts
Pie Charts are extensively used in statistics and business for explaining data and work results, in mass media for comparison (i.e. to visualize the percentage for the parts of one total), and in many other fields. The Pie Charts solution for ConceptDraw PRO v10 offers powerful drawing tools, varied templates, samples, and a library of vector stencils for simple construction and design of Pie Charts, Donut Chart, and Pie Graph Worksheets.
 Manufacturing and Maintenance
Manufacturing and maintenance solution extends ConceptDraw PRO software with illustration samples, templates and vector stencils libraries with clip art of packaging systems, industrial vehicles, tools, resources and energy.
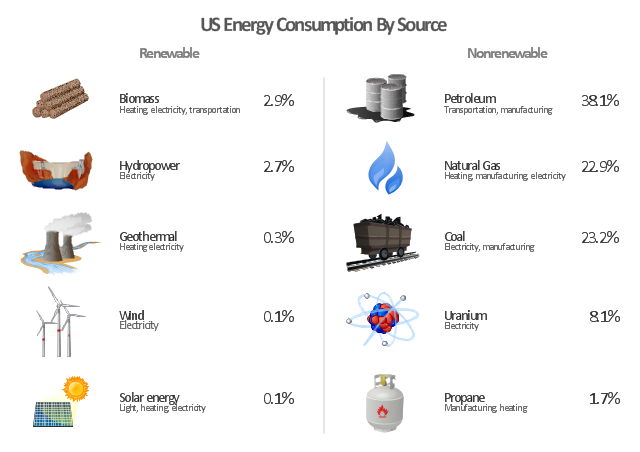
"The United States is the 800th largest energy consumer in terms of total use in 2010. ...
The majority of this energy is derived from fossil fuels: in 2010, data showed 25% of the nation's energy came from petroleum, 22% from coal, and 22% from natural gas. Nuclear power supplied 8.4% and renewable energy supplied 8%, which was mainly from hydroelectric dams although other renewables are included such as wind power, geothermal and solar energy." [Energy in the United States. Wikipedia]
The infographics example "U.S. energy consumption by source" was created in the ConceptDraw PRO diagramming and vector drawing software using the Manufacturing and Maintenance solution from the Illustration area of ConceptDraw Solution Park.
 Divided Bar Diagrams
The Divided Bar Diagrams Solution extends the capabilities of ConceptDraw PRO v10 with templates, samples, and a library of vector stencils for drawing high impact and professional Divided Bar Diagrams and Graphs, Bar Diagram Math, and Stacked Graph.
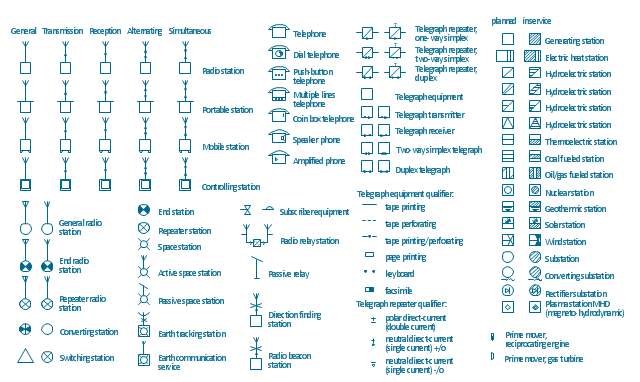
The vector stencils library "Stations" contains 110 symbols of communications equipment, generating, transmitting and receiving stations; substations; satellites; and power plants for power generation and distribution and radio relay systems.
"A power station (also referred to as a generating station, power plant, powerhouse or generating plant) is an industrial facility for the generation of electric power. At the center of nearly all power stations is a generator, a rotating machine that converts mechanical power into electrical power by creating relative motion between a magnetic field and a conductor. The energy source harnessed to turn the generator varies widely. It depends chiefly on which fuels are easily available, cheap enough and on the types of technology that the power company has access to. Most power stations in the world burn fossil fuels such as coal, oil, and natural gas to generate electricity, and some use nuclear power, but there is an increasing use of cleaner renewable sources such as solar, wind, wave and hydroelectric." [Power station. Wikipedia]
"Radio broadcasting is a one-way wireless transmission over radio waves intended to reach a wide audience. Stations can be linked in radio networks to broadcast a common radio format, either in broadcast syndication or simulcast or both. Audio broadcasting also can be done via cable radio, local wire television networks, satellite radio, and internet radio via streaming media on the Internet.
The signal types can be either analog audio or digital audio." [Radio broadcasting. Wikipedia]
The shapes example "Design elements - Stations" was drawn using the ConceptDraw PRO diagramming and vector drawing software extended with the Electrical Engineering solution from the Engineering area of ConceptDraw Solution Park.
 25 Typical Orgcharts
The 25 Typical Orgcharts solution contains powerful organizational structure and organizational management drawing tools, a variety of professionally designed organization chart and matrix organization structure samples, 25 templates based on various orga
- Renewable energy | Pie Charts | Divided Bar Diagrams | Example Of ...
- Renewable Example
- Non Renewable Sources Of Energy
- EU countries map - Renewable electricity generation | Energy ...
- Examples Of Non Renewable Energy
- Diagram Of Renewable Resource
- Flow Chart Of Renewable Nd Non Renewable Sources
- Diagram Of Renewable Solar Energy Sources
- Renewable Natural Resources Examples
- Renewable Energy Sources Drawing Charts On It
- Renewable Sources Of Energy Diagram Picture
- Simple Diagram Of Renewable Sources
- A Pictorial Chart Of Renewable Source Of Energy
- Diagram Of Renewable And Nonrenewable Resources
- Non Renewable Energy Sources Drawing
- Resources and energy - Vector stencils library | Energy resources ...
- Examples Of Energy Sources
- Solar Energy Examples
- Energy Pyramid Diagram | Resources and energy - Vector stencils ...
- Diagram Of Renewable Sources

