Reporting & Data Visualization
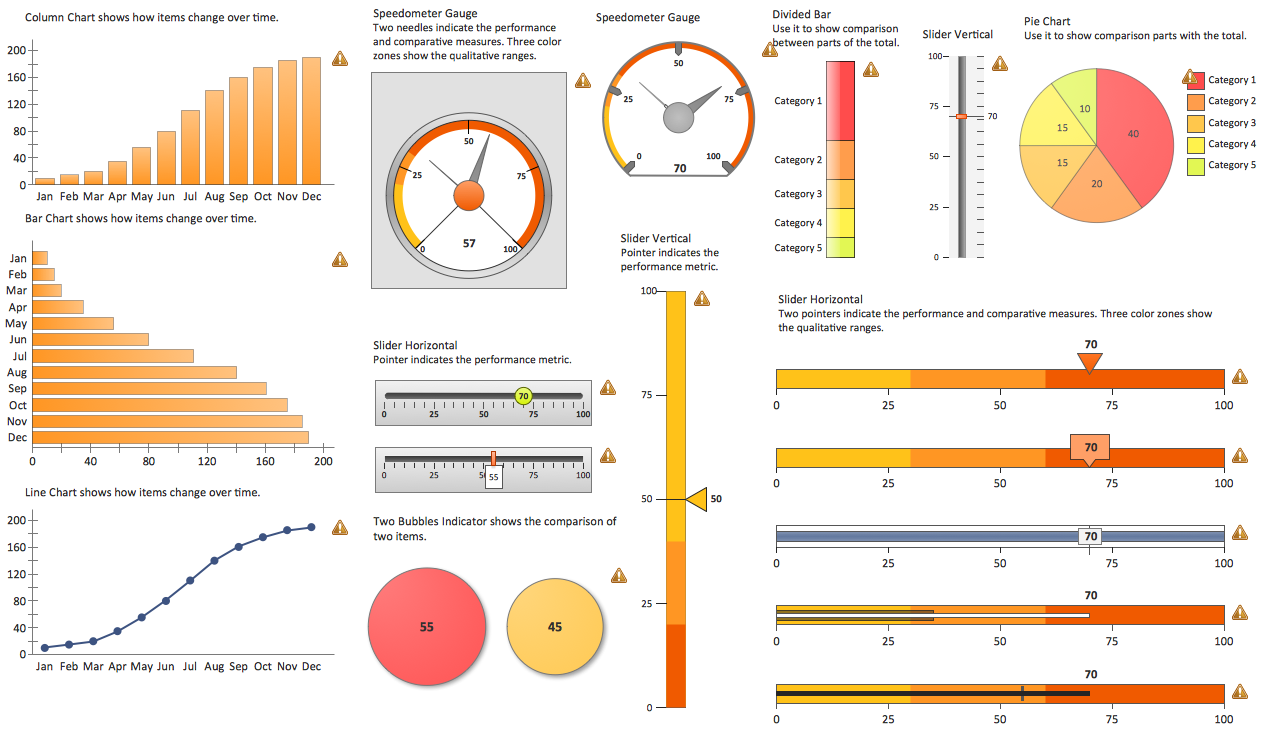
Using professional reporting and data visualization is the way your business can improve. ConceptDraw Sales Dashboard solution allows you produce live dashboards show KPI to monitor you sales activity and results in real time.Data Visualization Software Solutions
To see how your business can improve you can try data visualization software solutions that allows you visualize all your sales KPI in one sales dashboard allows you monitor and analyse sales activities.Line Chart Template for Word
This sample was created in ConceptDraw PRO diagramming and vector drawing software using the Line Graphs Solution from Graphs and Charts area of ConceptDraw Solution Park.This sample shows the Line Chart of annual percentage change. The Line Chart allows you to clearly see the changes of data over the time.
Data Visualization Solutions
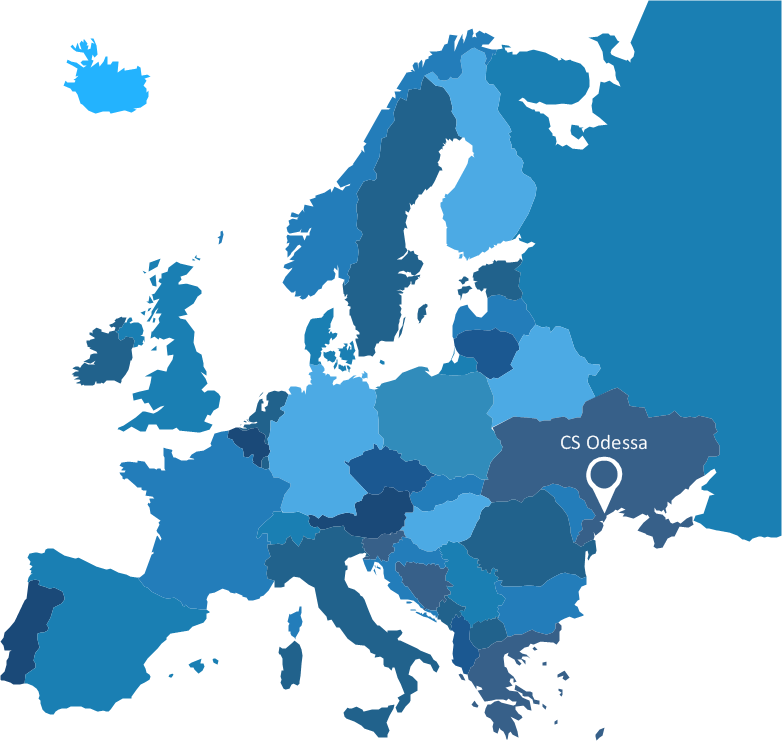
Data visualization solutions help you to see how your business can improve. Visualizing sales data using ConceptDraw Sales Dashboard gives you a bird's-eye view of the sale process.Visualization Spatial Data Using Thematic Maps Combined with Infographics
Now anyone can build an infographics from their data using ConceptDraw.Nice and simple, but the features it have are power-packed!
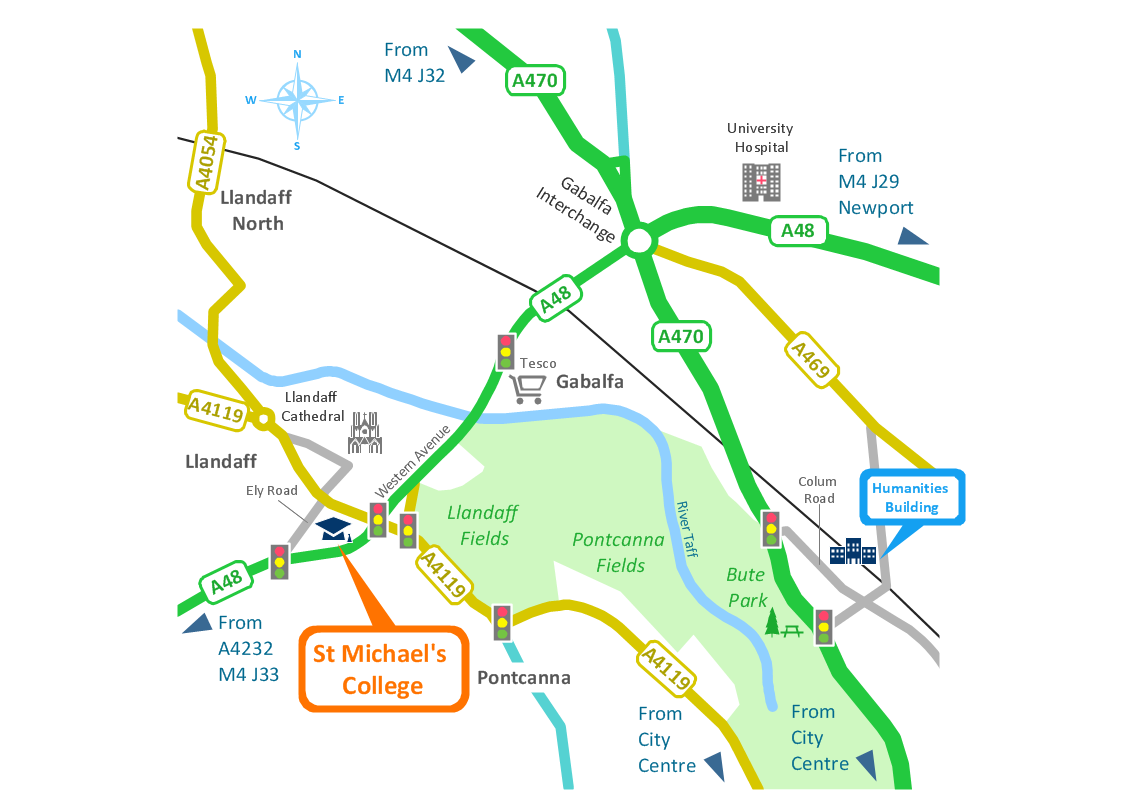
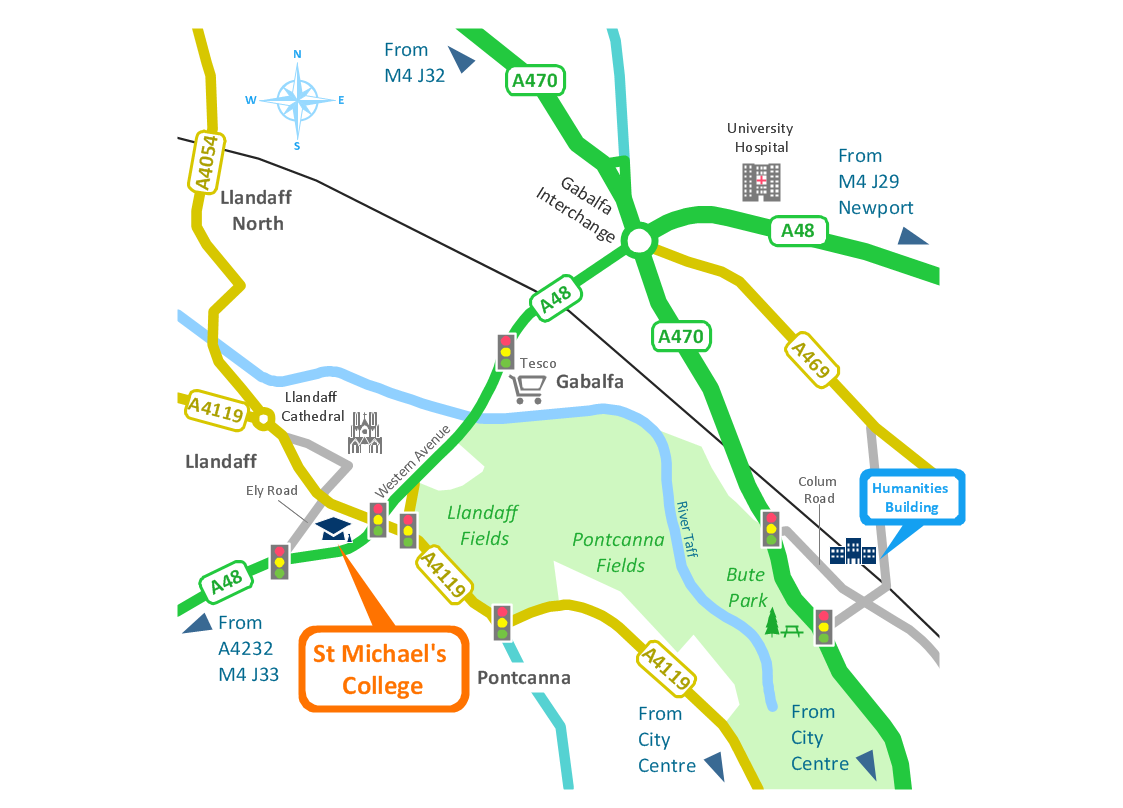
Brilliant Examples of Infographics Map, Transport, Road
ConceptDraw PRO contains spatial infographics samples, map templates to be filled in, and libraries of vector stencils for main design elements of spatial infographics.The Facts and KPIs
Visualizing sales data help you see the facts and KPIs about your sales process to make conclusions and see how your business can improve.Tools to Create Your Own Infographics
Over the past few centuries, data visualization has evolved so much that we use it every day in all areas of our lives. Many believe that infographic is an effective tool of storytelling, as well as analytics, and that it is able to overcome most of the language and educational barriers. Understanding the mechanisms of human perception will help you to understand how abstract forms and colors used in data visualization can transmit information more efficient than long paragraphs of text.Excellent Examples of Infographic Maps
Create Spatial infographics with ConceptDraw using its excellent examples of infographic maps. We hope these can inspire and teach you!Map Infographic Design
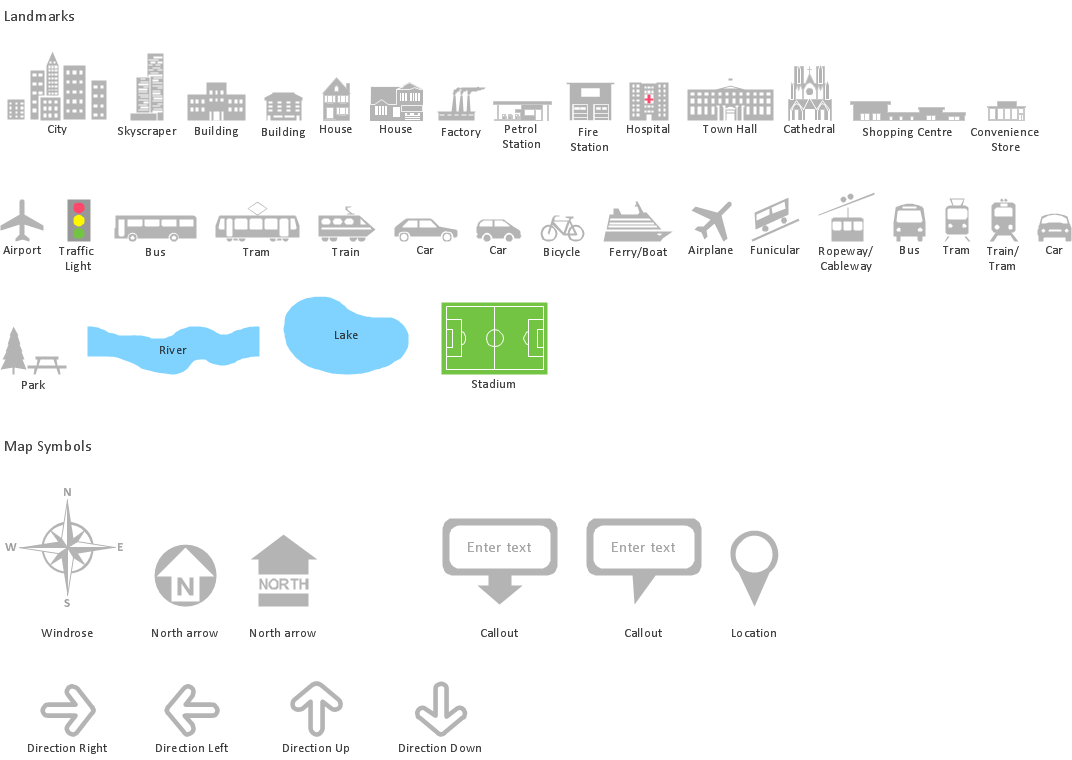
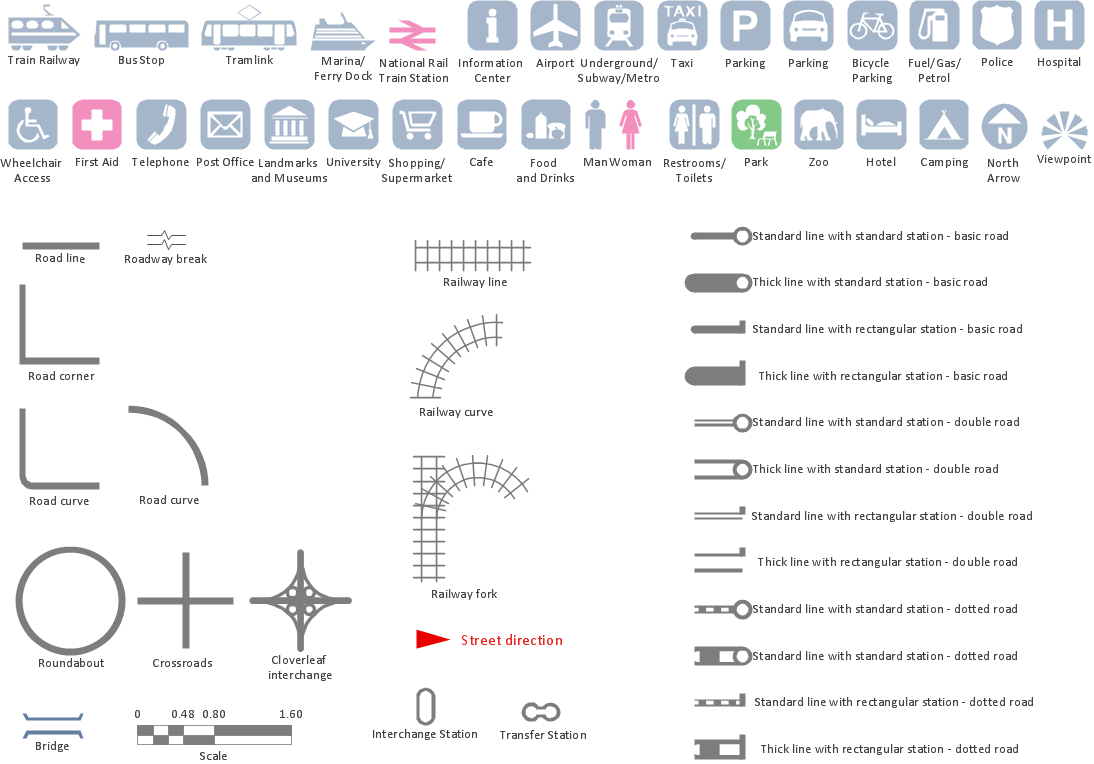
ConceptDraw collection of vector elements for infographics design.How To Create Project Report
ConceptDraw PROJECT contains an extensive tool set to help project managers. The rich data visualization capability that is provided by ConceptDraw products helps you create project dashboards, one-click reports, multi-project views, Gantt charts, and resource views. Let′s learn how to get maximum value using ConceptDraw PROJECT!Spatial Infographics
Not everyone can make spatial infographics from scratch, ConceptDraw will help you to create your own infographics.Map Infographic Maker
Take inspiration with ConceptDraw to visualise your maps and make eye-catching infographics.Transportation Infographics
ConceptDraw is a visualization Software for making transportation infographics. Infographics design vector elements and vector graphics which will surely help you in your design process.Map Infographic Tool
ConceptDraw is a data visualization tool, which can help you to create a map infographics. Anyone can do this, it's that easy!- Business Report Pie. Pie Chart Examples | Reporting & Data ...
- Data Visualization Solutions | Map Infographic Tool | Infographics ...
- Data Visualization Software Solutions | Data Visualization Solutions ...
- Visualizing Kpi
- Template For Sales Report Ppt
- Sales KPI Dashboards | KPIs and Metrics | Reporting Dashboard ...
- Reporting Dashboard Software for Business | Sales Teams are ...
- Reporting Dashboard Software for Business | Business Intelligence ...
- Project Management Visualization Tools
- Sales Dashboard Template | Sales Dashboard - insight about ...
- Sample Sales Data And Graphs Report
- How To Create Project Report | | Business Intelligence Dashboard ...
- A KPI Dashboard | A KPI Dashboard Provides the Answers Your ...
- Sales KPI Dashboards | KPIs and Metrics | A KPI Dashboard | Kpi ...
- Sales KPI Dashboards | A KPI Dashboard | The Facts and KPIs ...
- Data Samples For Business
- Pie Chart | Business Report Pie. Pie Chart Examples | Line Chart ...
- How To Create Project Report | Product Overview | Collaboration in ...
- Visualization Spatial Data Using Thematic Maps Combined with ...
- A KPI Dashboard Provides the Answers Your Sales Team | Online ...
