Business Report Pie. Pie Chart Examples
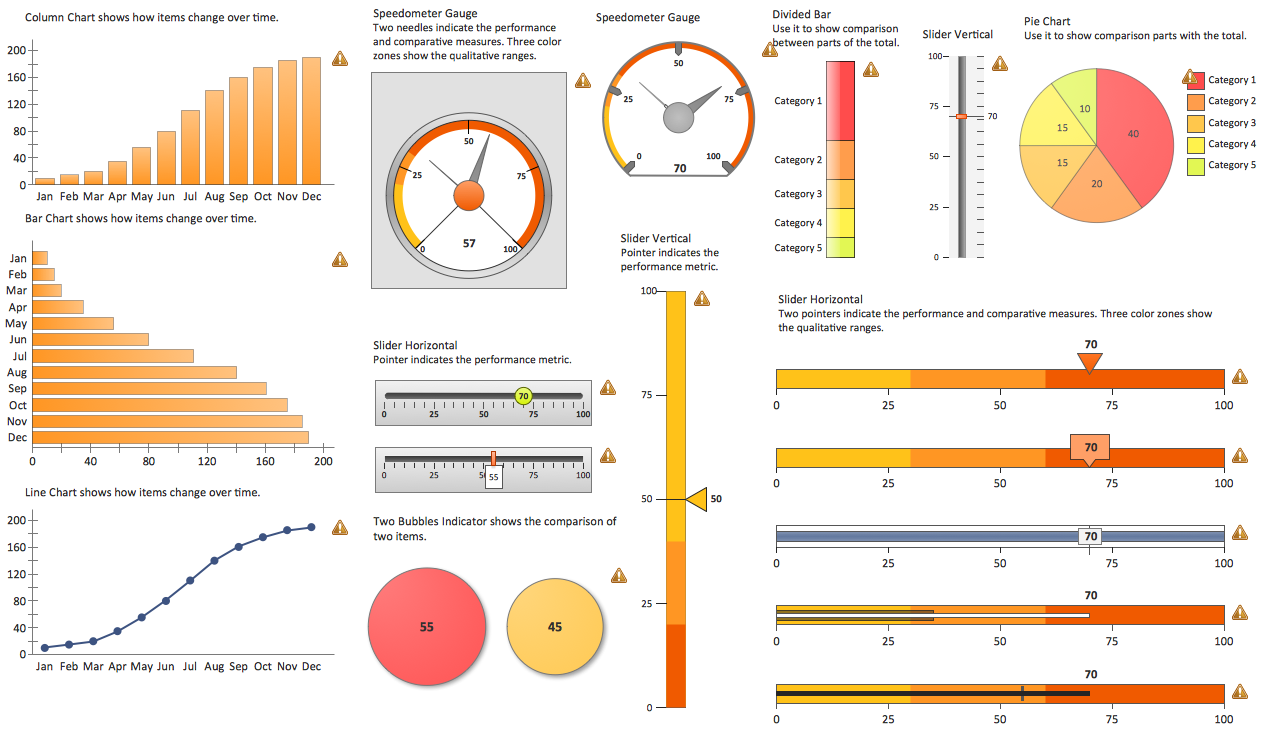
This sample shows the Business Report Pie Chart. The Pie Chart visualizes the data as the proportional parts of a whole, illustrates the numerical proportion. Pie Charts are very useful in the business, statistics, analytics, mass media.Design Pictorial Infographics. Design Infographics
In the course of recent decades data visualization went through significant development and has become an indispensable tool of journalism, business intelligence and science. The way visual information may be conveyed is not limited simply to static or dynamic representation, it can also be interactive. Infographics can be conditionally divided into several general levels. Primarily, this is level of visualization of information, its interpretation and association on any ground. Second level can be defined as a visualization of knowledge, depiction of thoughts and ideas in the form of images or diagrams. Finally, the level of data visualization, which processes data arrays in charts, enabling the information to be more clearly perceived. You can also identify the main approaches to the creation of infographics: exploratory and narrative. Exploratory method insists on minimalist design in favor of data precision without unnecessary details and is common for scientific researches and anaHow to Report Task's Execution with Gantt Chart
ConceptDraw PROJECT’s powerful reporting engine lets you generate a set of tabular reports with just one click, or visualize your project as Radial Tasks Structures, Work Breakdown Structures and Resource Calendars. It also provides you with dynamic Project Dashboards.The vector stencils library "Business people" contains 36 business people icons.
Use it to design your business and finance illustrations and infographics with ConceptDraw PRO diagramming and vector drawing software.
The vector stencils library "Business people" is included in the Business and Finance solution from the Illustration area of ConceptDraw Solution Park.
Use it to design your business and finance illustrations and infographics with ConceptDraw PRO diagramming and vector drawing software.
The vector stencils library "Business people" is included in the Business and Finance solution from the Illustration area of ConceptDraw Solution Park.
Types of Map - Overview
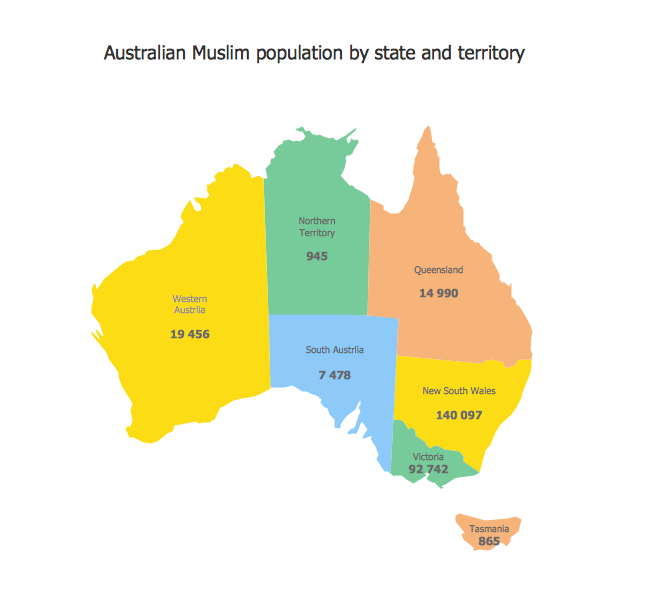
ConceptDraw defines some map types, divided into three categories. Every map type has specific shapes and examples.Reporting & Data Visualization
Using professional reporting and data visualization is the way your business can improve. ConceptDraw Sales Dashboard solution allows you produce live dashboards show KPI to monitor you sales activity and results in real time.Geo Map - Europe - Hungary
The vector stencils library Hungary contains contours for ConceptDraw PRO diagramming and vector drawing software. This library is contained in the Continent Maps solution from Maps area of ConceptDraw Solution Park.
 Education
This solution extends ConceptDraw PRO and ConceptDraw MINDMAP with specific content that helps illustrate educational documents, presentations, and websites quickly and easily with astronomy, chemistry, math and physics vector pictures and clip art.
Geo Map - Canada - Newfoundland and Labrador
Newfoundland and Labrador is the easternmost province of Canada. The vector stencils library Newfoundland and Labrador contains contours for ConceptDraw PRO diagramming and vector drawing software. This library is contained in the Continent Maps solution from Maps area of ConceptDraw Solution Park.Network Security Devices
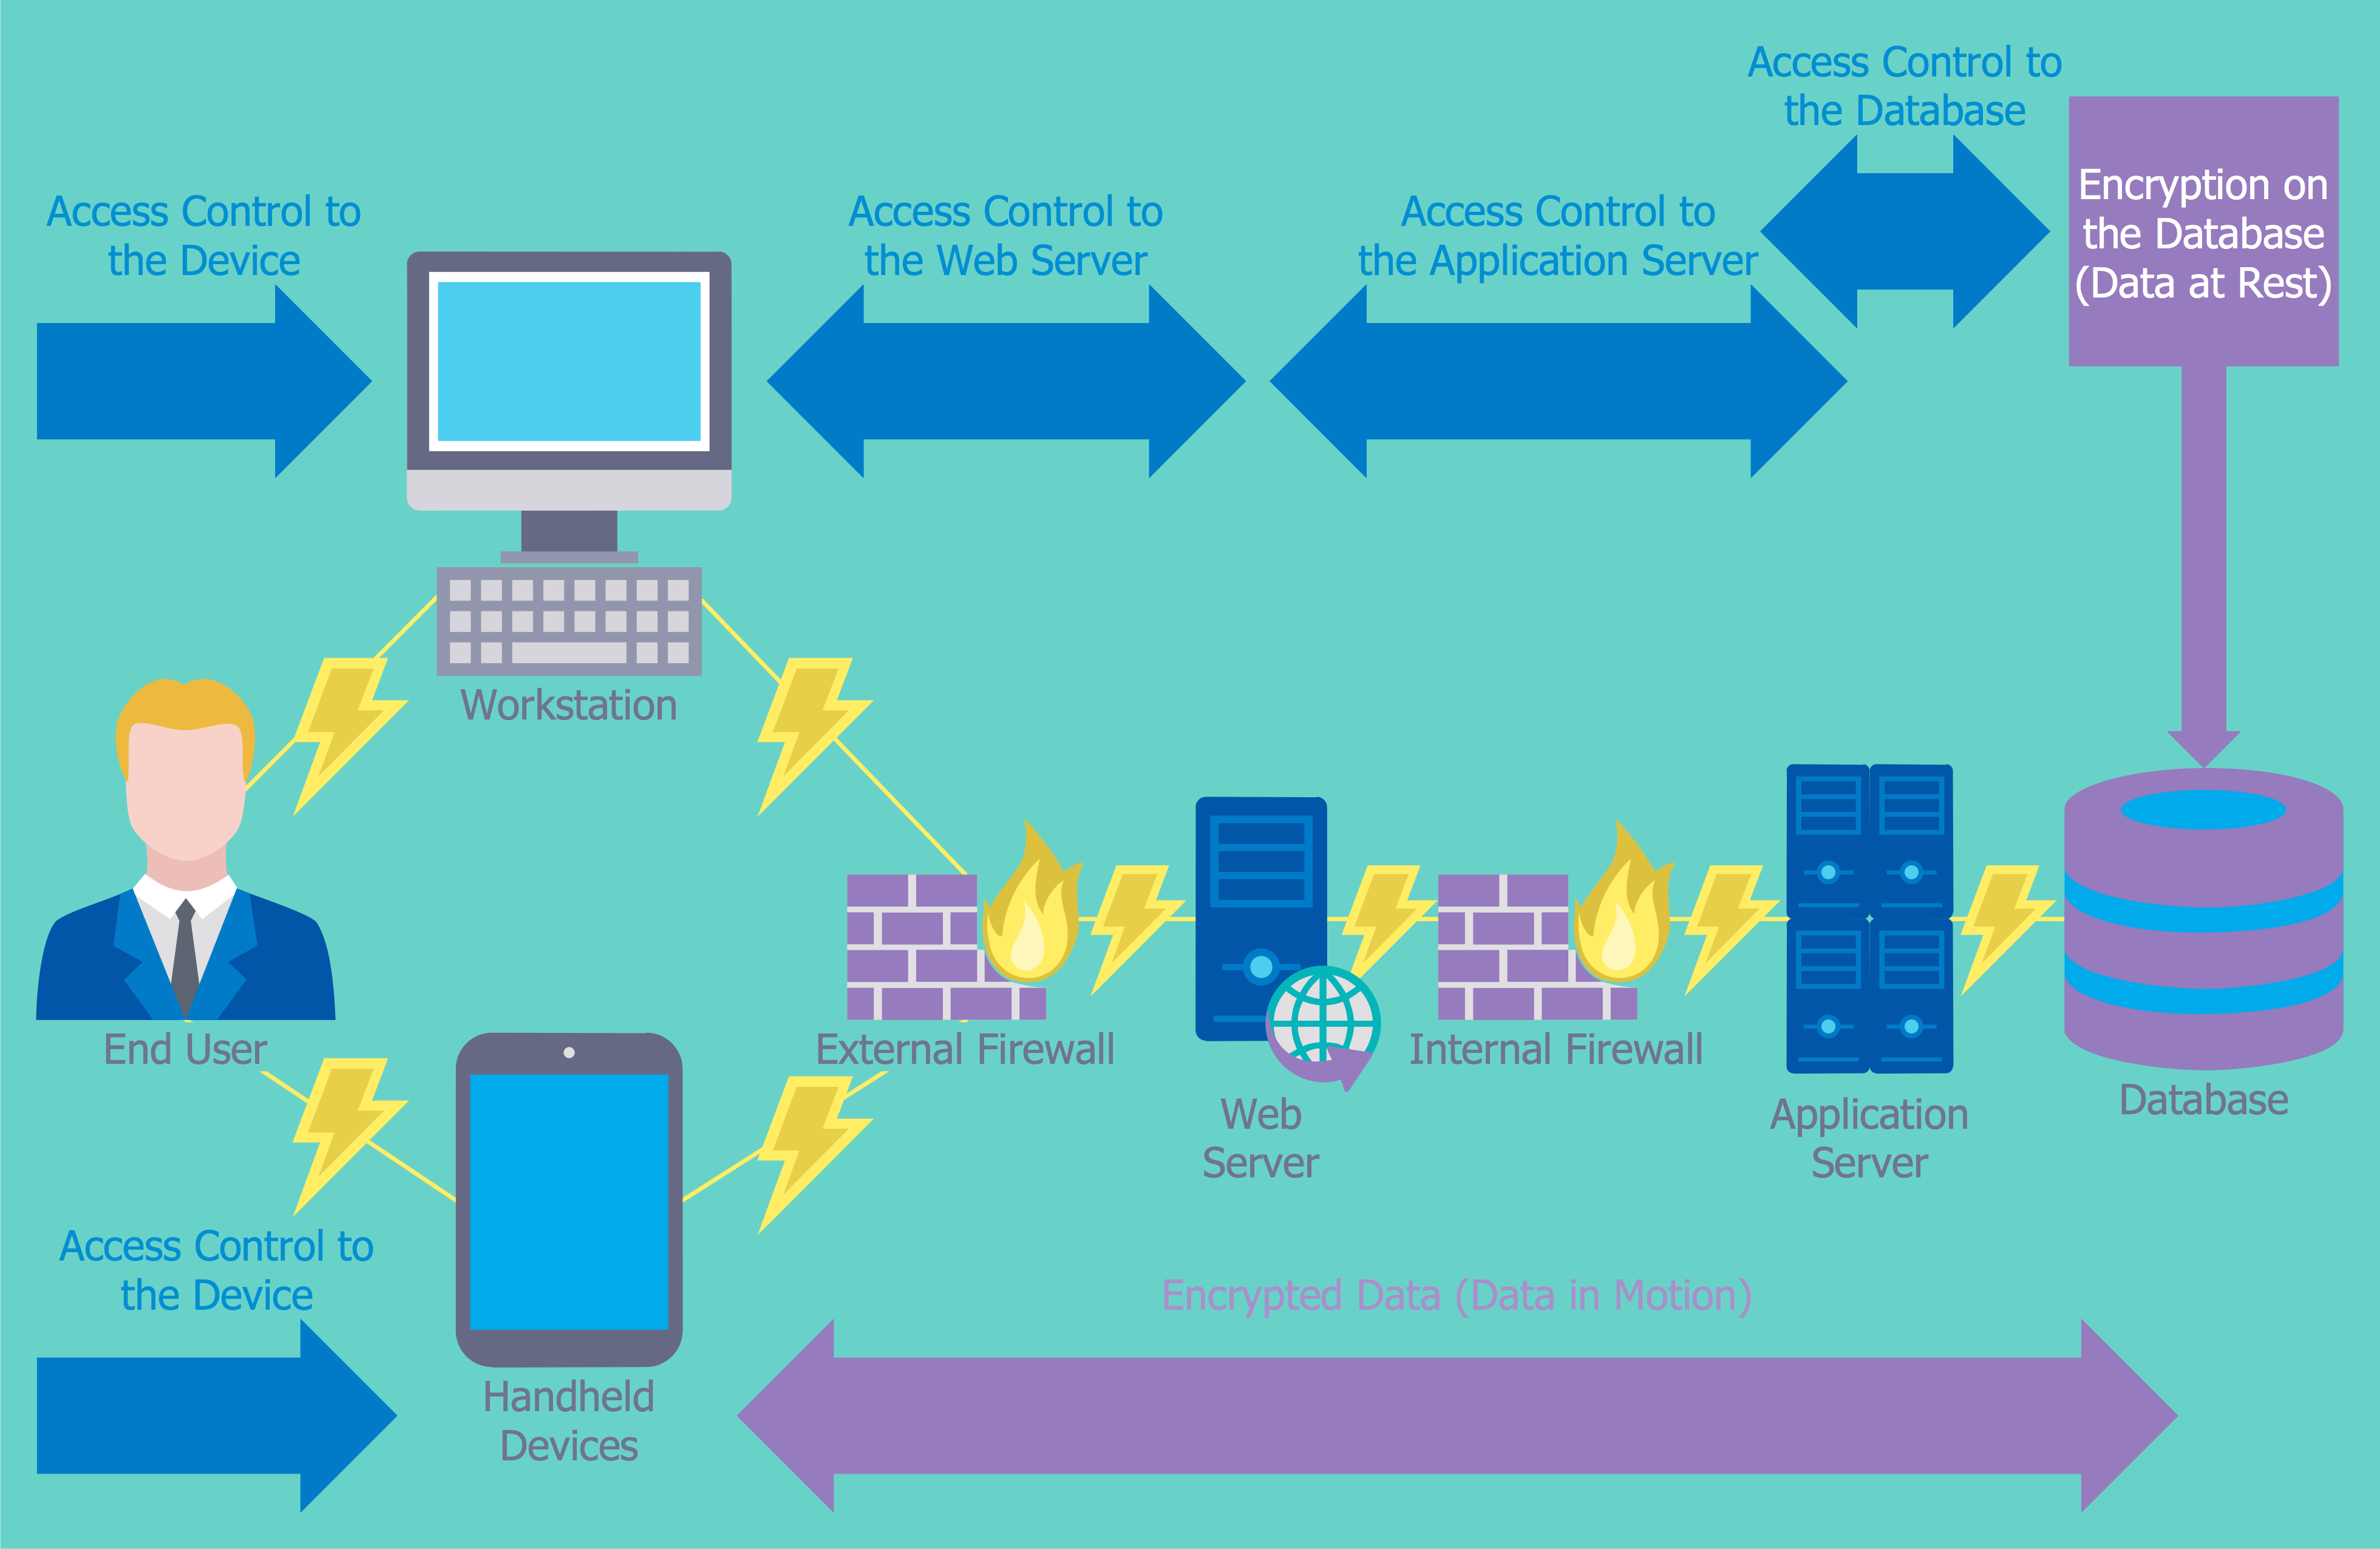
How to describe the necessity of using network security devices and visually illustrate this information? Now, it's very easy thanks to the ConceptDraw PRO diagramming and vector drawing software extended with Network Security Diagrams Solution from the Computer and Networks Area of ConceptDraw Solution Park.Accounting Flowchart Purchasing Receiving Payable and Payment
Accounting flowchart is a pictorial way to represent the flow of data in an organization and the flow of transactions process in a specific area of its accounting or financial department. Accounting Flowcharts solution contains the full set of standardized accounting flowchart symbols which will help you design in minutes various types of Accounting Flowcharts including such popular diagrams which represent the whole accounting process: Purchasing Flowchart, Receiving Flowchart, Voucher Payable Flowchart, Treasurer Flowchart, Payment Flowchart.How to Create Presentation of Your Project Gantt Chart
During the planning, discussing and execution of a project you may need to prepare a presentation using project views such as the Gantt Chart, Multiproject Dashboard or Resource Usage View. It’s easy do with ConceptDraw PROJECT!Geo Map - Europe - Croatia
The vector stencils library Croatia contains contours for ConceptDraw PRO diagramming and vector drawing software. This library is contained in the Continent Maps solution from Maps area of ConceptDraw Solution Park.Netflow architecture. Computer and Network Examples
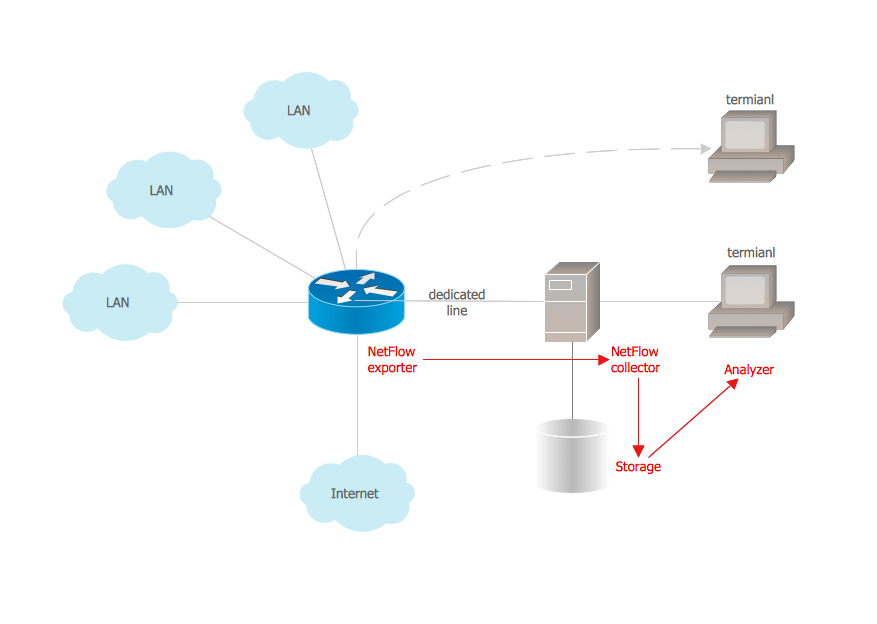
Netflow is a network protocol used for accounting the IP network traffic. It was developed by Cisco Systems. Now it is actually the industrial standard, it is supported by many devices. There are several versions of the protocol, but the most common are the versions 5 and 9. This diagram was created in ConceptDraw PRO using the Computer and Networks Area of ConceptDraw Solution Park and shows the Netflow architecture.
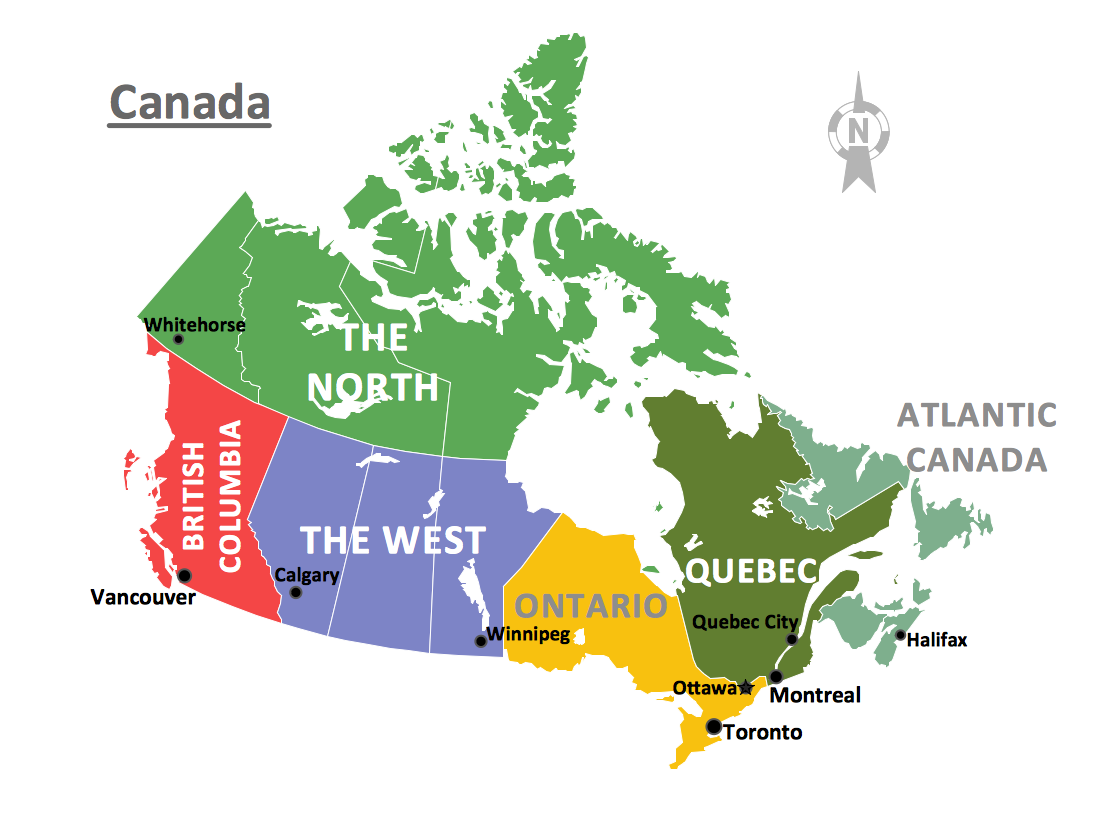
Geo Map - Canada
Canada is a country in North America consisting of 10 provinces and 3 territories. ConceptDraw PRO is idea to draw the geological maps of Canada from the pre-designed vector geo map shapes.- Business Report Pie. Pie Chart Examples | Pie Chart | Create ...
- Software - Vector stencils library | How to Brainstorm with ...
- Sales Growth. Bar Graphs Example | Line Chart Examples ...
- How To Create Project Report | Cross Functional Flowchart ...
- Reports Of Branded Goods
- How to Publish Project Reports on the Web Using ConceptDraw PRO
- Business Report Pie. Pie Chart Examples | How to Report Task's ...
- Status Dashboard | Project management task status dashboard ...
- Business People Clipart | HR workflow - Vector stencils library ...
- PM Dashboards | Status Dashboard | How To Create Project Report ...
- Business Report Pie. Pie Chart Examples | Examples of Flowcharts ...
- Flow Chart Given In Project Report
- Business People Clipart | Business - Design Elements | Advertising ...
- Presentation Clipart | Business People Clipart | Business - Design ...
- Medicine and health pictograms - Vector stencils library | Medicine ...
- Business Report Pie. Pie Chart Examples | Flow Chart Diagram ...
- Business Report Pie. Pie Chart Examples | Sales Growth. Bar ...
- Reporting Process Flow Chart
- Reporting Flow Chart Template
- Financial Reporting Process Flow Chart


