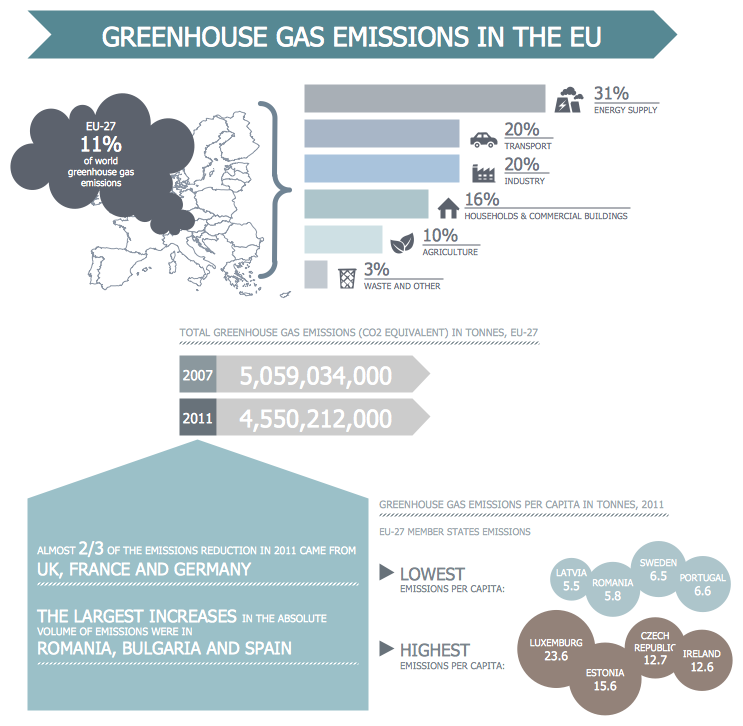
Infographic Generator
ConceptDraw PRO extended with Typography Infographics Solution from the “Infographics” Area is the best Infographic Generator. Make sure in it right now! Typography Infographics Solution offers you the best numerous collection of predesigned infographics examples and 9 libraries with large quantity of ready-to-use vector stencils that will help you design your own Typography Infographics of any complexity in minutes..Management Consultant
A management consultant is an important person for the company, he helps in the questions of improving business performance and increasing profits, he consults for the questions of business strategy, management and financial controls, resources, and also suggests recommendations for changing the structure of the company if needed.
So, every day management consultant conduct the complex work and often use the helpful management infographics for explain his thoughts and arguments to the company direction. Thanks to the development of computer technologies, drawing of management infographics is so easy today. ConceptDraw PRO diagramming and vector drawing software offers you the Management Infographics Solution from the Business Infographics Area.
 Timeline Diagrams
 Seven Management and Planning Tools
Process Flowchart
The main reason of using Process Flowchart or PFD is to show relations between major parts of the system. Process Flowcharts are used in process engineering and chemical industry where there is a requirement of depicting relationships between major components only and not include minor parts. Process Flowcharts for single unit or multiple units differ in their structure and implementation. ConceptDraw PRO is Professional business process mapping software for making Process flowcharts, Process flow diagram, Workflow diagram, flowcharts and technical illustrations for business documents and also comprehensive visio for mac application. Easier define and document basic work and data flows, financial, production and quality management processes to increase efficiency of your business with ConcepDraw PRO. Business process mapping software with Flowchart Maker ConceptDraw PRO includes extensive drawing tools, rich examples and templates, process flowchart symbols and shape libraries, smart connectors that allow you create the flowcharts of complex processes, process flow diagrams, procedures and information exchange. Process Flowchart Solution is project management workflow tools which is part ConceptDraw Project marketing project management software. Drawing charts, diagrams, and network layouts has long been the monopoly of Microsoft Visio, making Mac users to struggle when needing such visio alternative like visio for mac, it requires only to view features, make a minor edit to, or print a diagram or chart. Thankfully to MS Visio alternative like ConceptDraw PRO software, this is cross-platform charting and business process management tool, now visio alternative for making sort of visio diagram is not a problem anymore however many people still name it business process visio tools.
 Azure Architecture
Onion Diagram Maker
The onion diagram is a type of diagram which shows the dependencies among parts of an organization or process. The items are displayed at the concentric circles, where the items at the bigger rings depend on the items at the smaller rings. ConceptDraw PRO diagramming and vector drawing software extended with Stakeholder Onion Diagrams Solution from the Management Area of ConceptDraw Solution Park is a professional Onion Diagram Maker.Construction Project Chart Examples
ConceptDraw PROJECT provides a set of construction Gantt chart examples. Project manager requires task tracking, and project examples best approach to start. Make your project applying one of our ready-made examples.
 Cafe and Restaurant Floor Plans
Activity Network (PERT) Chart
Activity Network and Project Evaluation and Review Technique, or PERT, charts are a way of documenting and analyzing the tasks in a project. This diagram is constructed as part of the process in creating a schedule of corrective actions. The Activity Network Chart (PERT) shows the logical connections and consequence of tasks to be performed. It displays the time period for problem solving and the implementation of all activities through the critical path.
 Cisco Network Diagrams
 Sport Field Plans
 Gym and Spa Area Plans
- Project plan timeline - Request for proposal ( RFP ) | Activity Network ...
- Project plan timeline - Request for proposal ( RFP ) | Activity Network ...
- Project plan timeline - Request for proposal ( RFP ) | Project timeline ...
- How to Make a Timeline | Project Timeline | Timeline Diagrams ...
- Construction Project Chart Examples | Best Tool for Infographic ...
- Project plan timeline - Request for proposal ( RFP ) | Project plan ...
- Timeline Examples | Timeline Diagrams | How To Create a MS Visio ...
- Cross-Functional Flowchart (Swim Lanes) | Best Tool for Infographic ...
- Project Timeline | Project plan timeline - Request for proposal ( RFP ...
- Service Request Template
- Sample Diagram Of A Business Proposal
- Construction Project Chart Examples | Program Evaluation and ...
- Network Diagramming Software for Design Cisco Network Diagrams ...
- Diagram Of Project Proposal
- Sample Timeline
- Timeline Examples | Timeline Diagrams | Timeline Diagrams ...
- Workflow diagrams - Vector stencils library | Customer types matrix ...
- Activity on Node Network Diagramming Tool | Activity Network ...
- Software Request
- Construction Project Chart Examples | Gantt Chart Templates ...


