HelpDesk
How to Design a Food-related Infographics Using ConceptDraw PRO
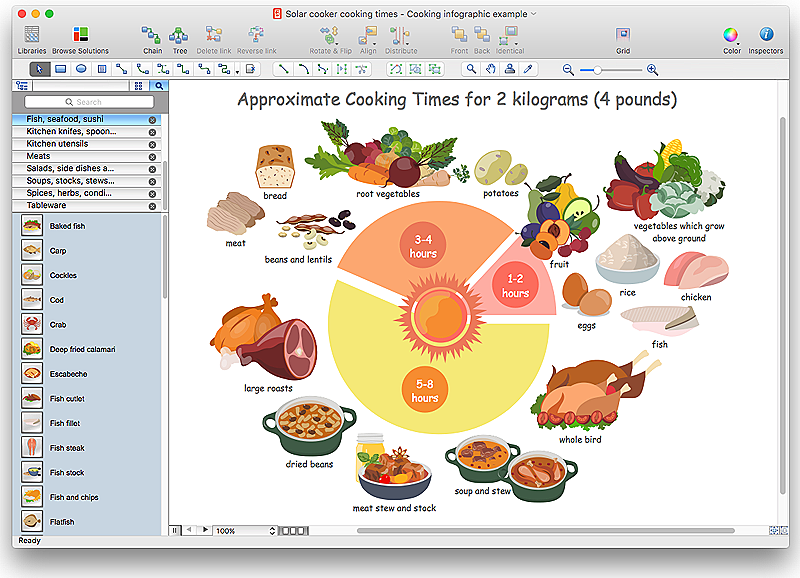
Today a large piece of business is referred to a food. This business can not be imagined without various kinds of visualizations. You can see them everywhere — on brand logos, in advertising, on menus and in flyers. Also different food related infographics is used to promote healthy nutrition and to deliver information on how to maintain an effective diet. ConceptDraw Cooking Recipes solution, offers a great collection of bright food-related images and icons, placed into themed libraries. It can be used for catering menu graphics, on marketing flyers, or as concomitant text for infographics.HelpDesk
How to Create Infographics that Help People Eat Healthy
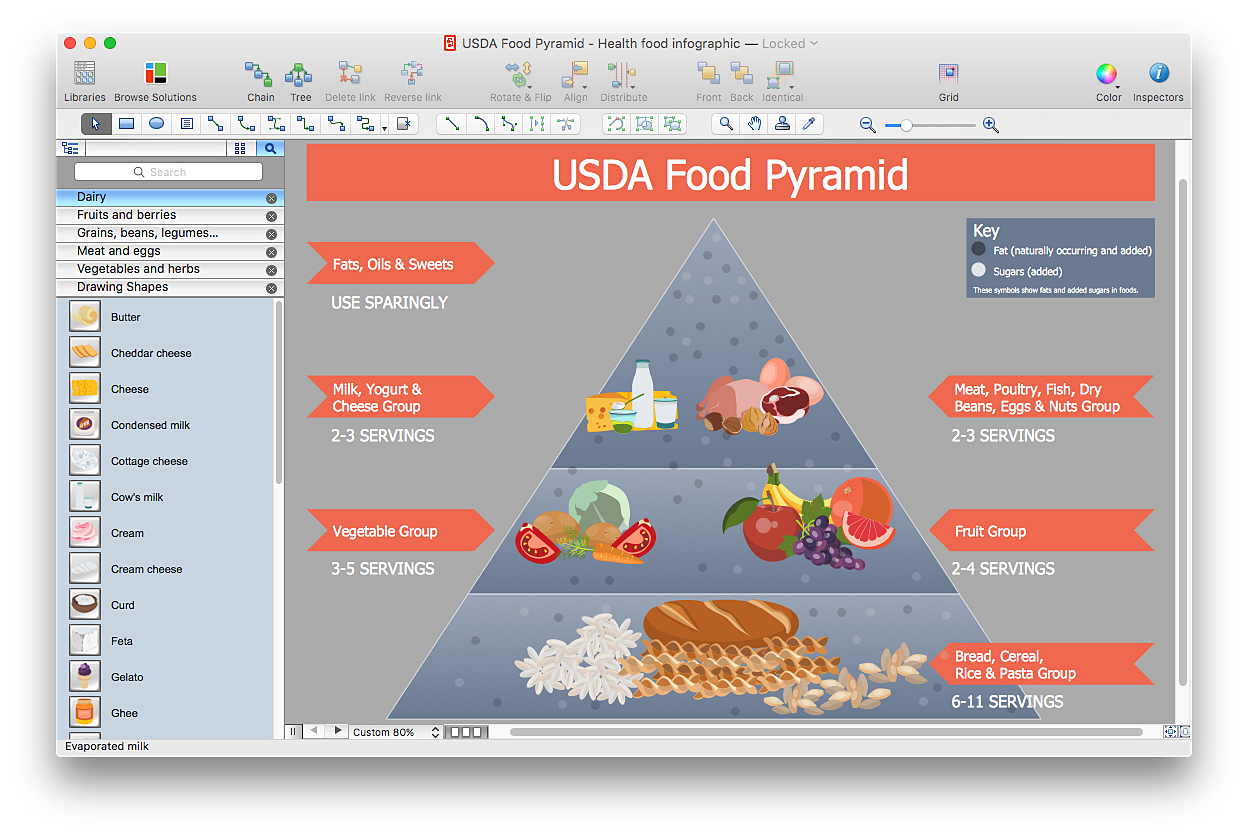
The most effective manner of presenting information on healthy diet and food nutrition is using various visualizations such as charts or infographics. To help easily create infographics and diagrams of healthy eating, ConceptDraw has provided the Health Food solution to its Solution Park. It contains vector stencil libraries of healthy eating options, samples of diagrams and infographics, and a set of templates to help you create your own diagrams, infographics and even adds. Using ConceptDraw PRO you can easily create and share healthy food recipes and materials about the proper nutrition.HelpDesk
How to Create a Typography Infographic Using ConceptDraw PRO
Infographics are a good way to visually share knowledge , to communicate information and illustrate a message. Typography Infographics can help to present at a glance a large pack of complex information in a clear and vivid manner. Designers use the elements of typography Infographics to compose a graphic presentation of an information that is intended to depict the information behind the numbers in a creative and interesting visual way. Each infographic element is used to depict and explain an idea of the current portion of information. Each infographic element must inform its message clearly. ConceptDraw PRO provides the ability to design different kinds of typography infographics. You can use ConceptDraw Typography Infographics solution to create typography infographics effortlessly and quickly using the special set of vector stencils libraries.HelpDesk
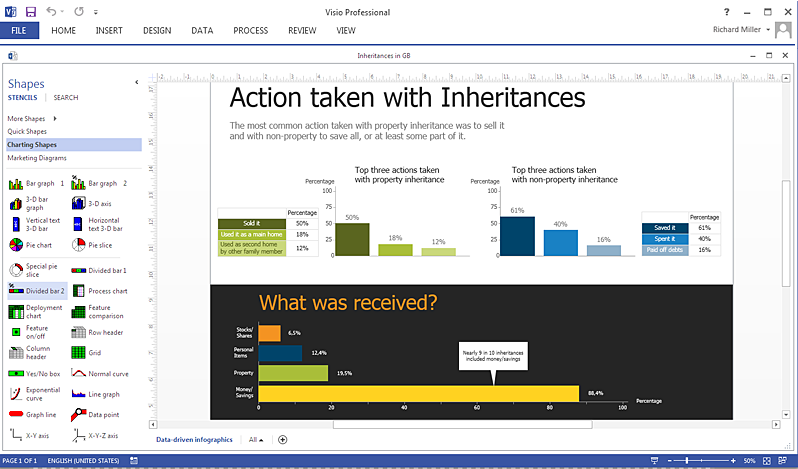
How to Add Data-driven Infographics to a MS Word Document Using ConceptDraw PRO
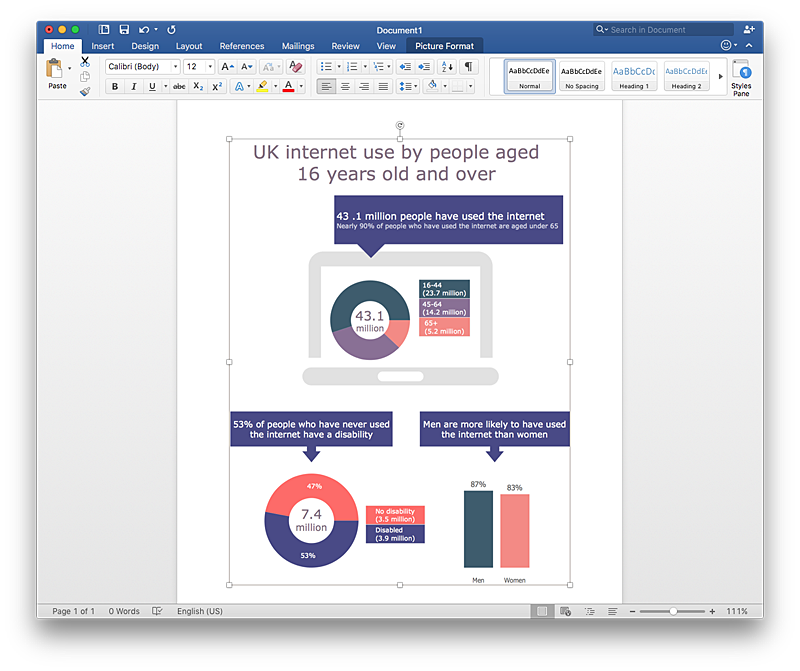
Infographics ae usually used as an effective way of showing a certain portion of information . There are a wide of range of subjects that can be represented in a such way. One of the most simple usage for the infographics, in business diagrams. Sales staff can use it as an effective method of sharing the sales results with the entire team and stakeholders. ConceptDraw Data-driven Infographics solution gives all the tools one need to present a certain type of data. ConceptDraw PRO allows you to easily create data-driven infographics and then insert them into a MS Word document.HelpDesk
How to Create Digital Media Infographics Using ConceptDraw PRO
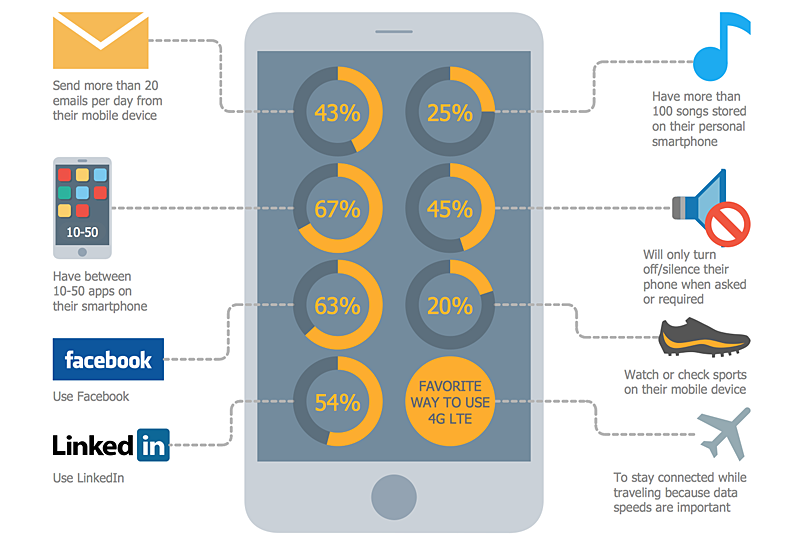
The information and communicating flow, surrounding all of us, is constantly growing. Our inquiries on new digital technologies and new gadgets also grow. Video, audio, media servises move ahead rapidly and our being is already impossible without them. Internet, email, mobile devices, etc. pass into significant piece of a daily life. Using the ConceptDraw Audio, Video, Media solution, you can make professional-looking schematics, dramatic infographics and presentations related to digital mobile, audio and video devices.HelpDesk
How to Create a Timeline Diagram in ConceptDraw PRO
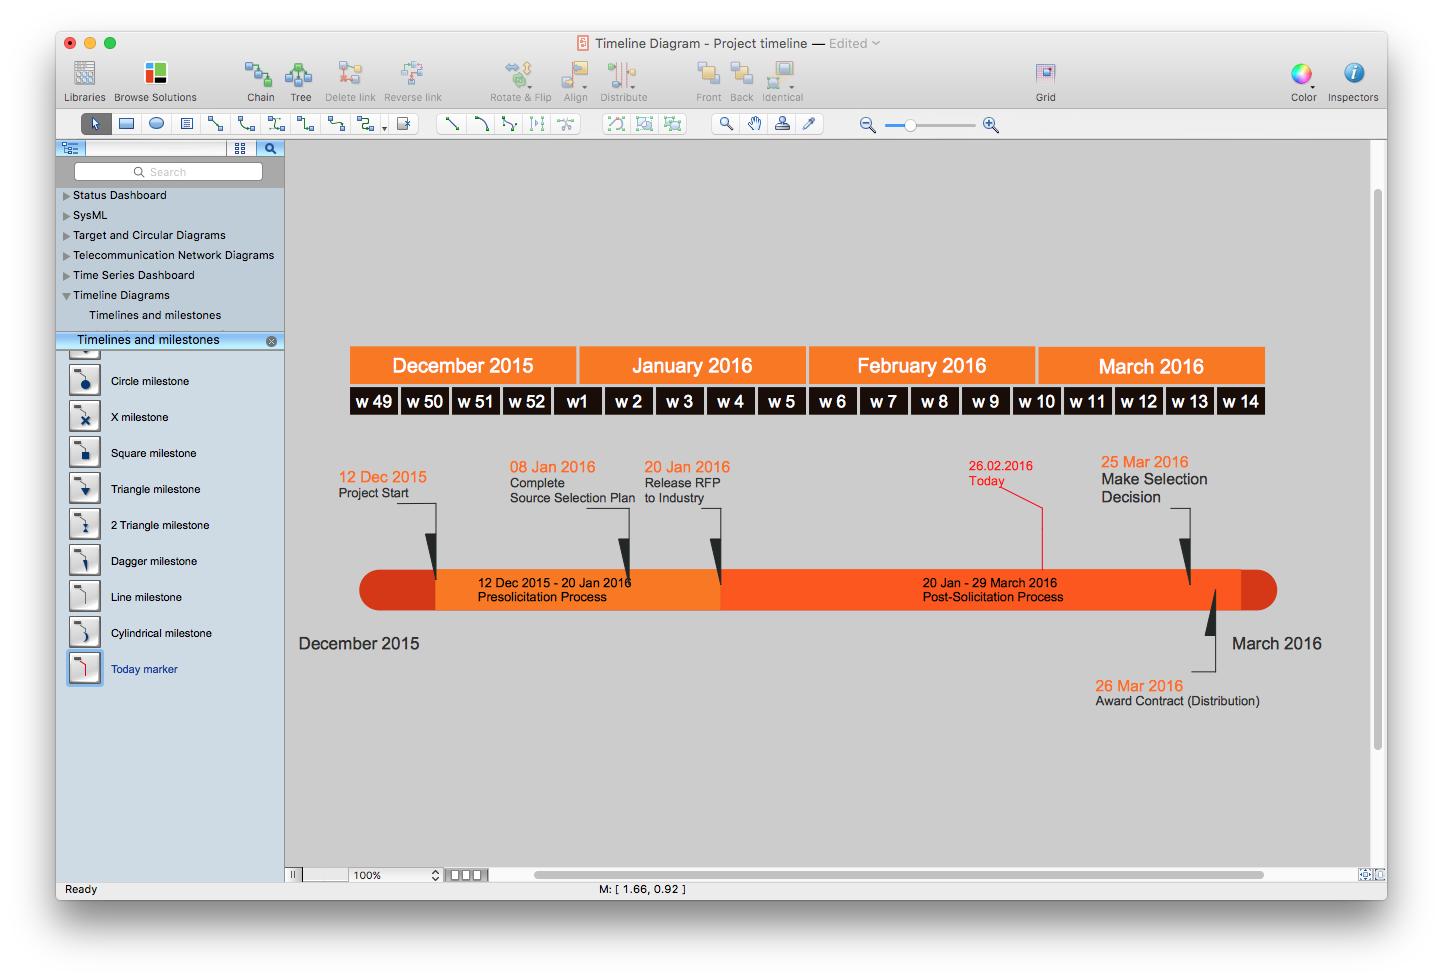
A Timeline is a chart which displays a project plan schedule in chronological order. A Timeline is used in project management to depict project milestones and visualize project phases, and show project progress. The graphic form of a timeline makes it easy to understand critical project milestones, such as the progress of a project schedule. Timelines are particularly useful for project scheduling or project management when accompanied with a Gantt chart. It captures the main of what the project will accomplish and how it will be done. making a project timeline is one of the most important skills a project manager needs have. Making comprehensive, accurate timelines allows you getting every project off in the best way. ConceptDraw PRO allows you to draw a timeline charts using special library.HelpDesk
How to Create an AWS Architecture Diagram
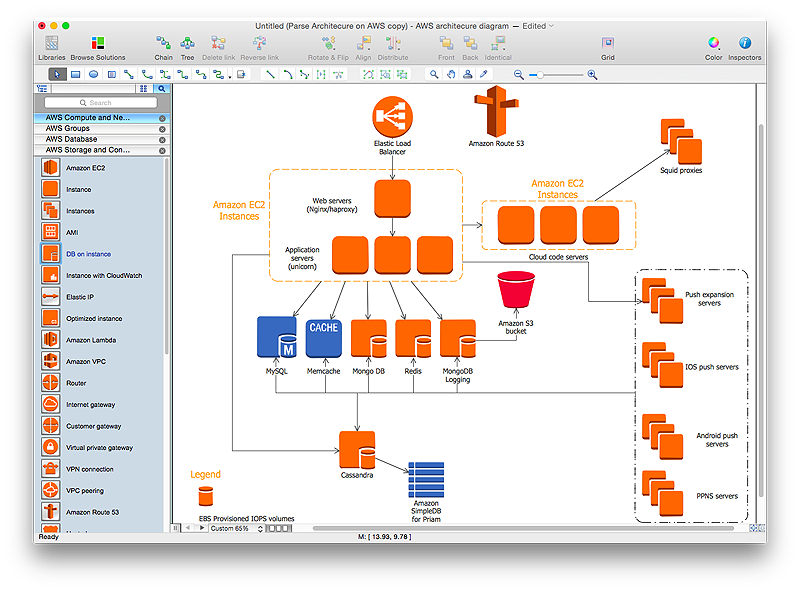
Displaying an Amazon Web Service (AWS) cloud actually requires large amounts of attention to detail. Every element of technology has to be addressed: software, middle ware, transaction processing, scaling, data storage; the complete list is staggering. Using the ConceptDraw AWS Architecture Diagrams solution makes much easier the work on documenting the Amazon Web Service architecture. The ConceptDraw AWS Architecture Diagrams solution includes icons, sample and templates for some Amazon Web Services products and resources, to be used when buiding architecture diagrams. The icons are simple so that user can easily incorporate them in his drawings. AWS Architecture Diagrams can be used in presentations, datasheets, or any other technical visualizations.HelpDesk
How to Create an Azure Architecture Diagram Using ConceptDraw PRO
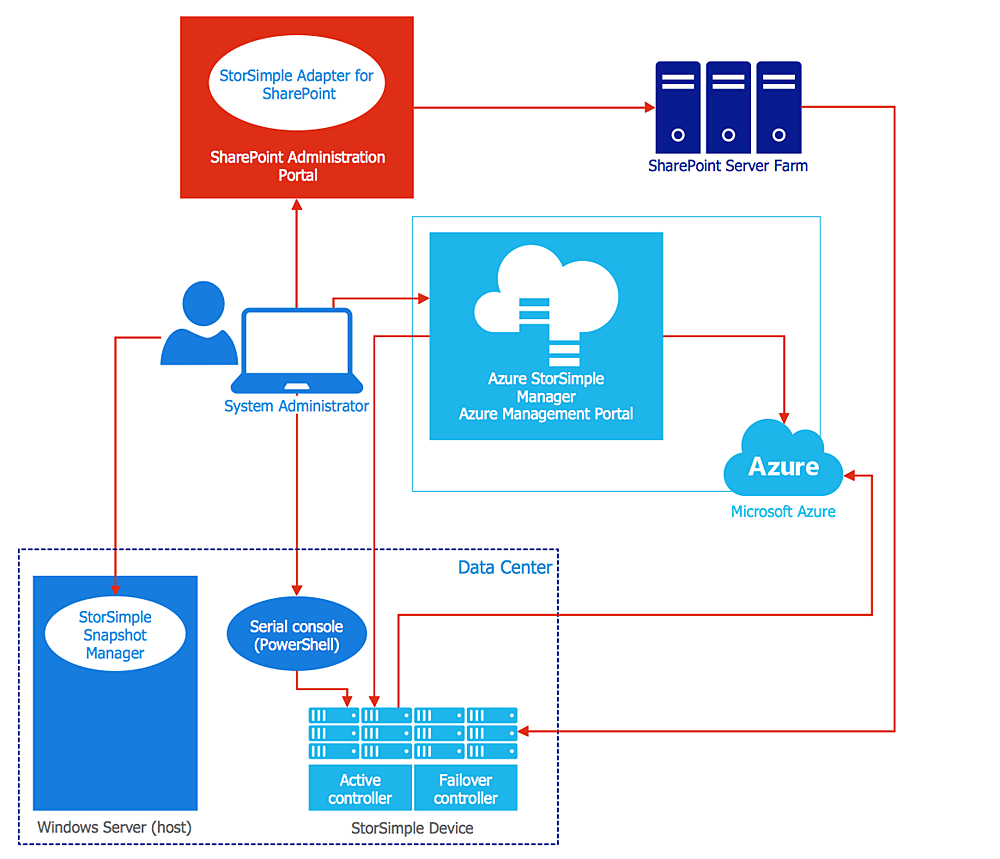
Microsoft Azure is an open cloud computing platform, designed by Microsoft. It provides the ability to develop and launch applications and to store data on servers in distributed data centers. Microsoft Azure cloud offers two models - platform as a service (PaaS) and infrastructure as a service (IaaS). The efficiency of the Windows Azure platform is supported by a global network of Microsoft data centers. Developers use Azure Architecture diagrams to visualize and document the architecture of applications bases on Microsoft Azure services. Using the ConceptDraw Azure Architecture solution makes much easier the work on documenting the Microsoft Azure architecture.HelpDesk
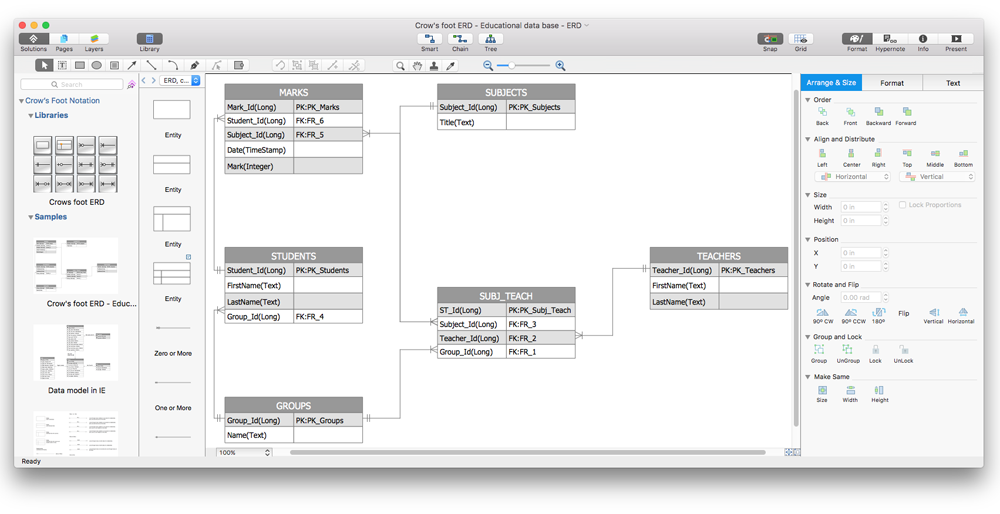
How To Make a Crow's Foot ER Diagram
The Crow's Foot ERD notation is often used in software engineering and database design. The originator of Crow’s Foot notation was Gordon Everest, who offered the idea of how to visually represent the different types of relationships that can exist between objects in an entity relationship diagram (ERD). The Crow’s Foot notation is often used in ER models to how a particular table data can reference data in other tables within a database. The free Crow's Foot Notation solution for ConceptDraw PRO offers a complete vector stencil library containing full standardized symbols of Crow's Foot notation.HelpDesk
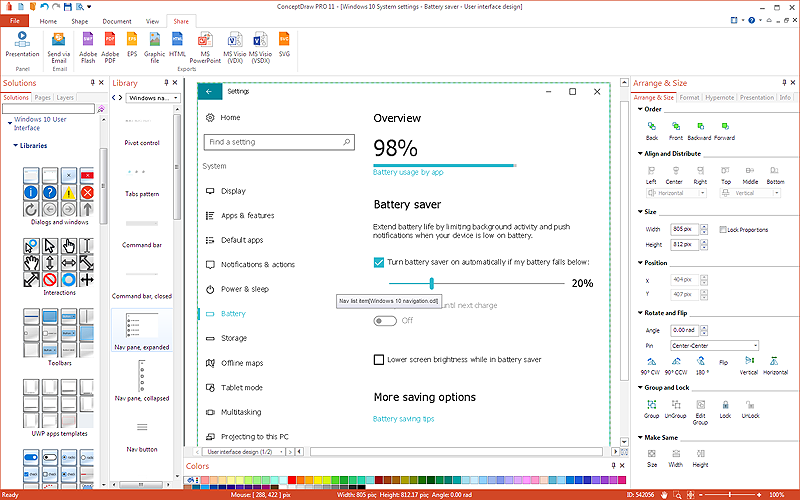
How to Design a Mockup of Windows 10 User Interface
The launch of Windows 10 with its the tile-based Modern UI design brings a lot of new opportunities for both designers and developers to build new apps. To design an effective user interface, graphic designers will create visual Graphic User Interface (GUI) prototypes, that focus on maximizing the user experience — searching for the most functional layout that attends to core user needs, while retaining an appropriate aesthetic. It is important to know how the user will interact with the UI, and how functionality and appearance will change, depending on the features being used at any one time. The Modern UI design style has its own unique principles and typography that can be managed using ConceptDraw PRO. The ability to design Windows 10 User Interface is delivered by the Windows 10 User Interface solution for Conceptdraw PRO.
 AWS Architecture Diagrams
The flexible AWS cloud solutions will help you to create reliable applications with a high level of scaling in the AWS cloud, to run your applications and accelerate their work on the level of security. Besides AWS resources are available worldwide and yo
HelpDesk
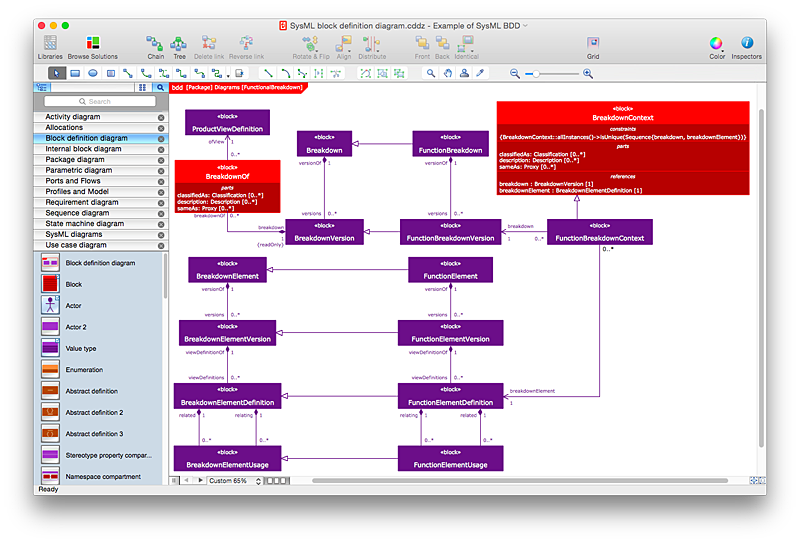
How to Create a SysML Diagram Using ConceptDraw PRO
Systems Modeling Language (SysML) is designed to use for system engineering. It is similar to UML, but much easier to learn. used by to system engineers what UML is to software engineers. Smaller in content and simpler to learn than UML. SysML is focused on standardizing the language used to describe engineering systems. SysML covers a broader range of systems, than can involve personnel, facilities, hardware or electrical components. SysML depicts system using the SysML diagrams. Making a SysML diagram involves many elements that can be managed using SysML solution for ConceptDraw PRO.HelpDesk
How To Create a MS Visio Data-driven Infographics Using ConceptDraw PRO
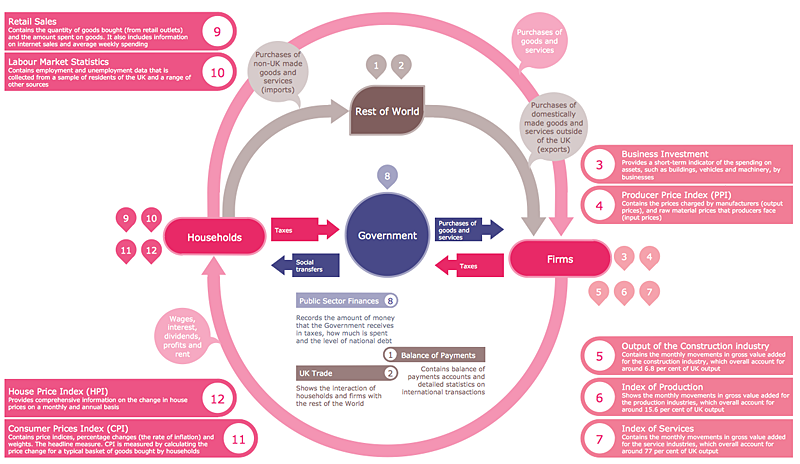
ConceptDraw PRO allows you to easily create data-driven infographics of any complexity and then make a MS Visio file from your diagram in a few simple steps.- Basic Flowchart Symbols and Meaning | Audit Flowchart Symbols ...
- Content Marketing Infographics | Design elements - Content Views ...
- Add Cloud Request Icon
- Design Pictorial Infographics . Design Infographics | How to Draw a ...
- Cisco People. Cisco icons , shapes, stencils and symbols | People ...
- How to Design a Fast-Food Restaurant Menu Using ConceptDraw ...
- Design Pictorial Infographics . Design Infographics | Sport ...
- Design elements - Beverages | Food and Beverage | Healthy Foods ...
- Design elements - Picture graphs | How to Draw Pictorial Chart . How ...
- Infographic Icon People
- Design elements - Android system icons (file) | Design elements ...
- How To Design Regulatory Documents with use of Standard GHS ...
- Education | Education Information | How to Support Your Mind Map ...
- Design Pictorial Infographics . Design Infographics | Sample Pictorial ...
- Design Pictorial Infographics . Design Infographics | How to Create ...
- Network Icon | Design elements - Azure architecture - Microsoft ...
- How To Create a MS Visio Data-driven Infographics Using ...
- Design Pictorial Infographics . Design Infographics | Design ...
- How to Design a Food-related Infographics Using ConceptDraw PRO
- Design Pictorial Infographics . Design Infographics | Sample Pictorial ...
