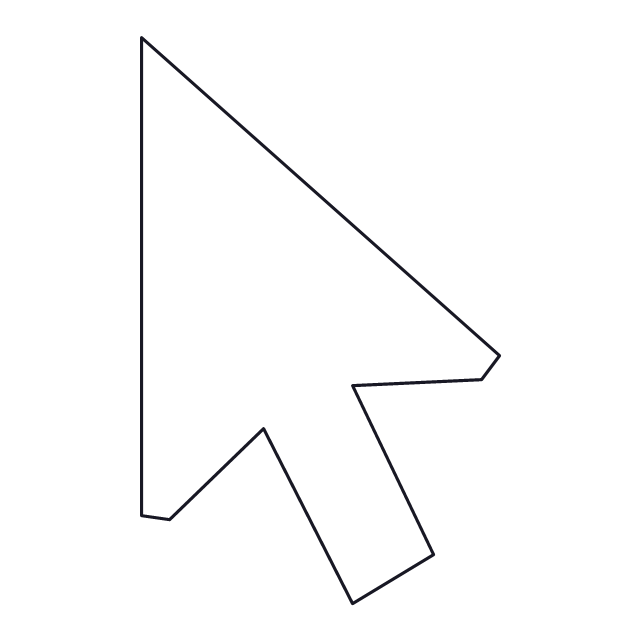
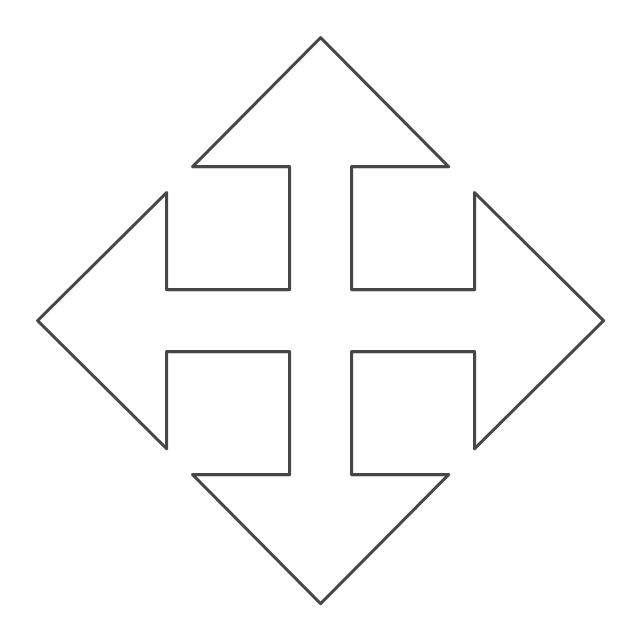
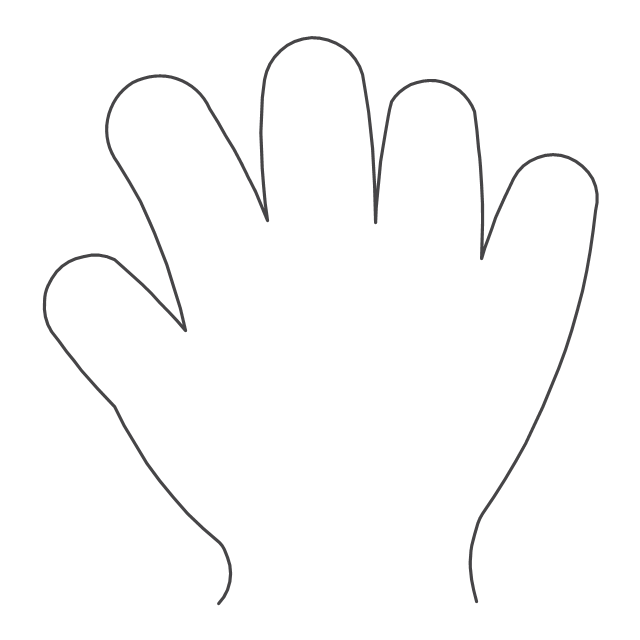
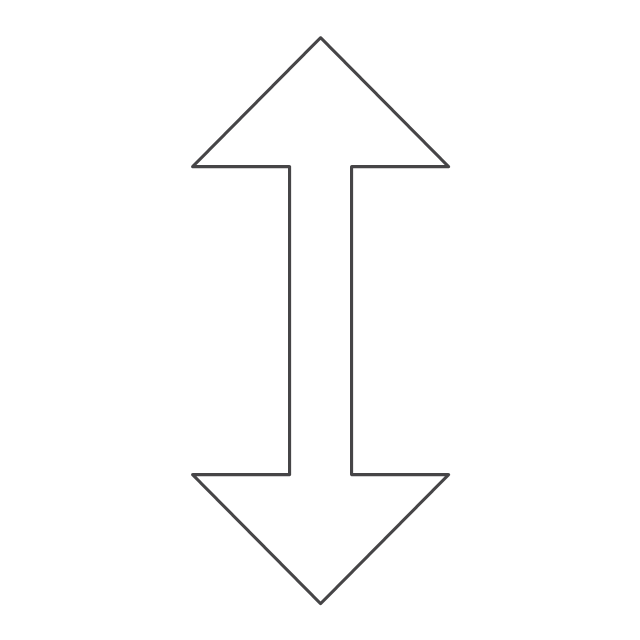
The vector stencils library "Interactions" contains 18 interaction elements icons: mouse pointers, splitters, select frame.
Use it to design graphic user interface (GUI) prototypes of your software applications for Windows 8.
"In computing, a pointer or mouse cursor (as part of a personal computer WIMP style of interaction) is a graphical image on the computer monitor or other display device. The pointer echoes movements of the pointing device, commonly a mouse or touchpad, and signals the point where actions of the user take place. It can be used to select and move other graphical user interface elements, and is distinct from the cursor, which responds to keyboard input. The cursor may also be repositioned using the pointer.
The pointer commonly appears as an angled arrow, (angled because historically that improved appearance on low resolution screens) but it can vary within different programs or operating systems. The use of a pointer is employed when the input method, or pointing device, is a device that can move fluidly across a screen and select or highlight objects on the screen." [Pointer (graphical user interfaces). Wikipedia]
The design elements example "Interactions - Vector stencils library" was created using the ConceptDraw PRO diagramming and vector drawing software extended with the Windows 8 User Interface solution from the Software Development area of ConceptDraw Solution Park.
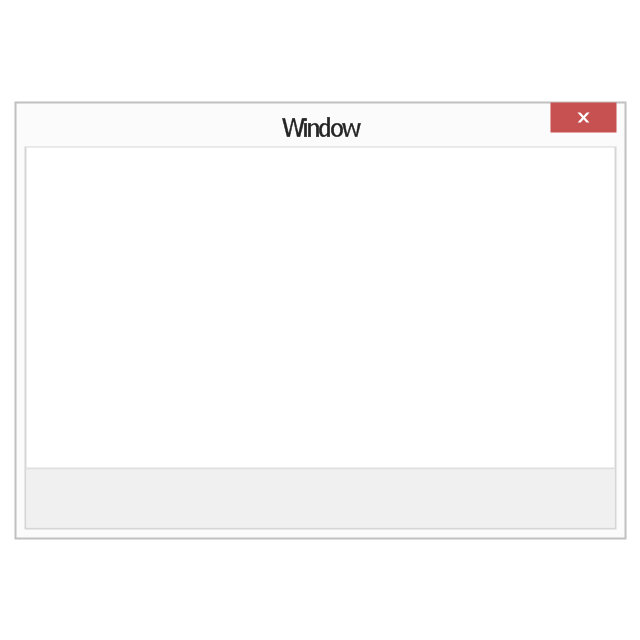
The vector stencils library "Window elements" contains 24 window elements: frames, boxes and buttons.
Use it to design graphic user interface (GUI) of your Windows 8 software application.
"A window is a graphical control element. It consists of a visual area containing some of the graphical user interface of the program it belongs to and is framed by a window decoration. It usually has a rectangular shape that can overlap with the area of other windows. It displays the output of and may allow input to one or more processes.
Windows are primarily associated with graphical displays, where they can be manipulated with a pointer by employing some kind of pointing device.
A graphical user interface (GUI) using windows as one of its main "metaphors" is called a windowing system, whose main components are the display server and the window manager." [Window (computing). Wikipedia]
The design elements example "Window elements - Vector stencils library" was created using the ConceptDraw PRO diagramming and vector drawing software extended with the Windows 8 User Interface solution from the Software Development area of ConceptDraw Solution Park.
Value Stream Mapping Symbols
VSM symbols are the best for a production process designing. The entire Value Stream Mapping method uses a graphical representation of the manufacturing process, factors' pros and cons, that all stakeholders can easily understand. Value Stream Mapping is a graphical technique that provides possibilities to improve analysis of a manufacturing process, at the stage of the transferring information or materials that required to deliver a product or service to the customer.IDEF0 Flowchart Symbols
The modeling of business and business processes is not quite a simple process for both small-size businesses and large businesses. The IDEF0 method is one of the popular and easy methods of modeling the business as a complex system. It is based on the functional modeling language Structured Analysis and Design Technique (abbr. SADT) and is concentrated on the activity modeling. According to this method are constructed the IDEF0 Diagrams and IDEF0 Flowcharts, which are succesfully used not only for documenting the business, but also for analysis, development, integration of information and software systems, reengineering, etc. This method suggests the use of special IDEF0 Flowchart Symbols from the IDEF0 notation for construction the IDEF0 Flowcharts. ConceptDraw DIAGRAM diagramming and vector graphic software extended with IDEF0 Diagrams solution from the Software Development area of ConceptDraw Solution Park is rich for the powerful drawing tools, built-in templates and samples, and predesigned IDEF0 flowchart symbols.Keyboard Shortcuts and Mouse Actions
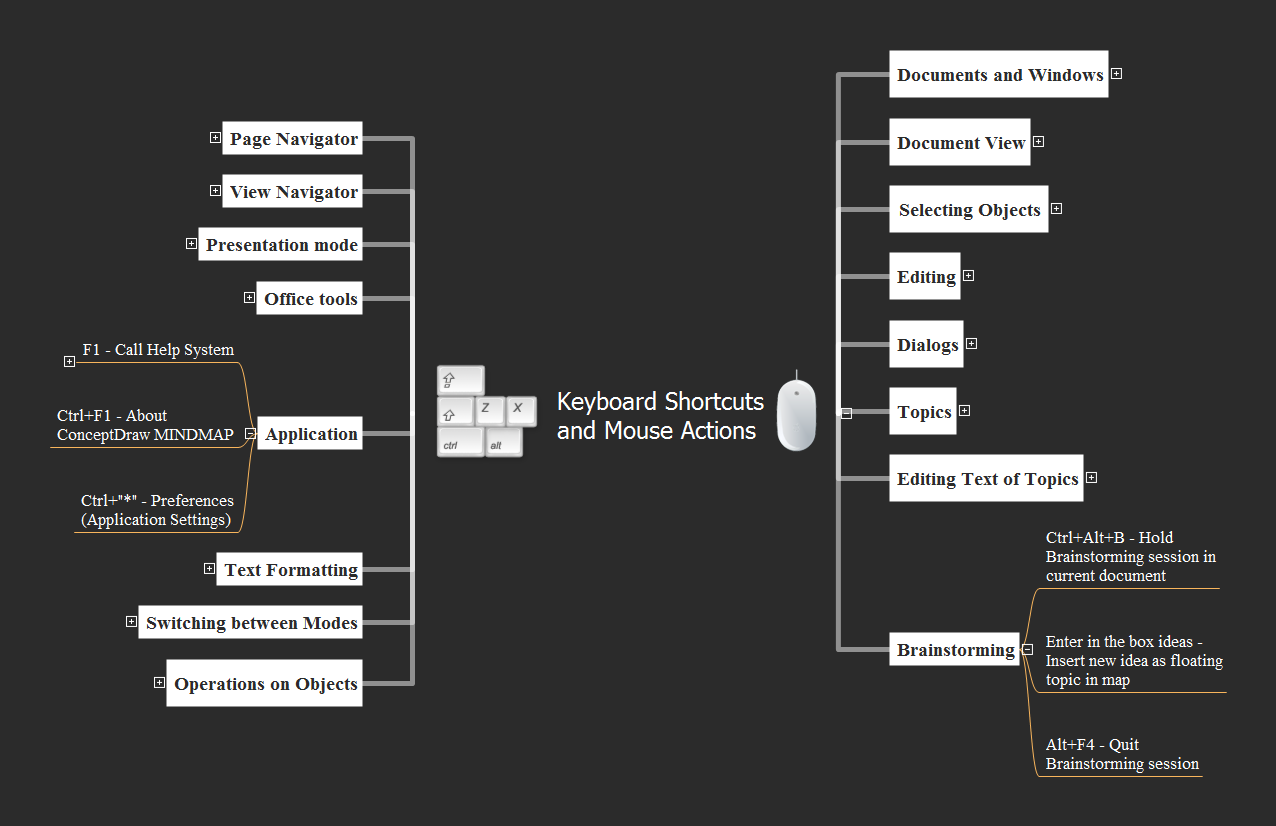
Mind Maps are an advanced technique used to solve a wide range of professional tasks, personal growth tasks, business tasks, household tasks that occur in everyday life. When you need to make a difficult decision in terms of lack of information, to prepare a report, design a presentation in original way, to organize a brainstorming session, to develop plan for the next week / month / year, to make notes during the lecture, in all these cases the mind mapping technique will be effective. The essence of the method consists in structuring the information, in visualization of objects and concepts, and also in setting the associative relationships. This method is popular in teaching and when explaining new information, and lets represent it in a concise and easily perceived form. Mind Maps can be also effectively used to represent different computer knowledge and helpful information about the use of different applications. ConceptDraw MINDMAP is powerful software for designing different Mind Maps, including the Mind Map demonstrating the keyboard shortcuts and mouse actions that are utilized in ConceptDraw MINDMAP.Process Flowchart Symbols
The Process Flowchart or Process Flowchart Diagram (PFD) is a visual representation relations between major parts of the system, the steps in a process, and even connections between various systems. The possibility to easy create professional-looking and attractive Process Flowcharts, Business Process Diagrams and Maps which visualize the steps of complex processes is provided by Business Process Diagram Solution from the Business Processes Area of ConceptDraw Solution Park and 16 libraries with 230 process flowchart symbols from BPMN 1.2 and BPMN 2.0.
 Windows 10 User Interface
Windows 10 User Interface solution extends significantly ConceptDraw DIAGRAM functionality with look-and-feel functions of GUI software and makes it a great assistant for Win10 designers, developers, and software engineers. This solution provides a wide s
Scrum workflow
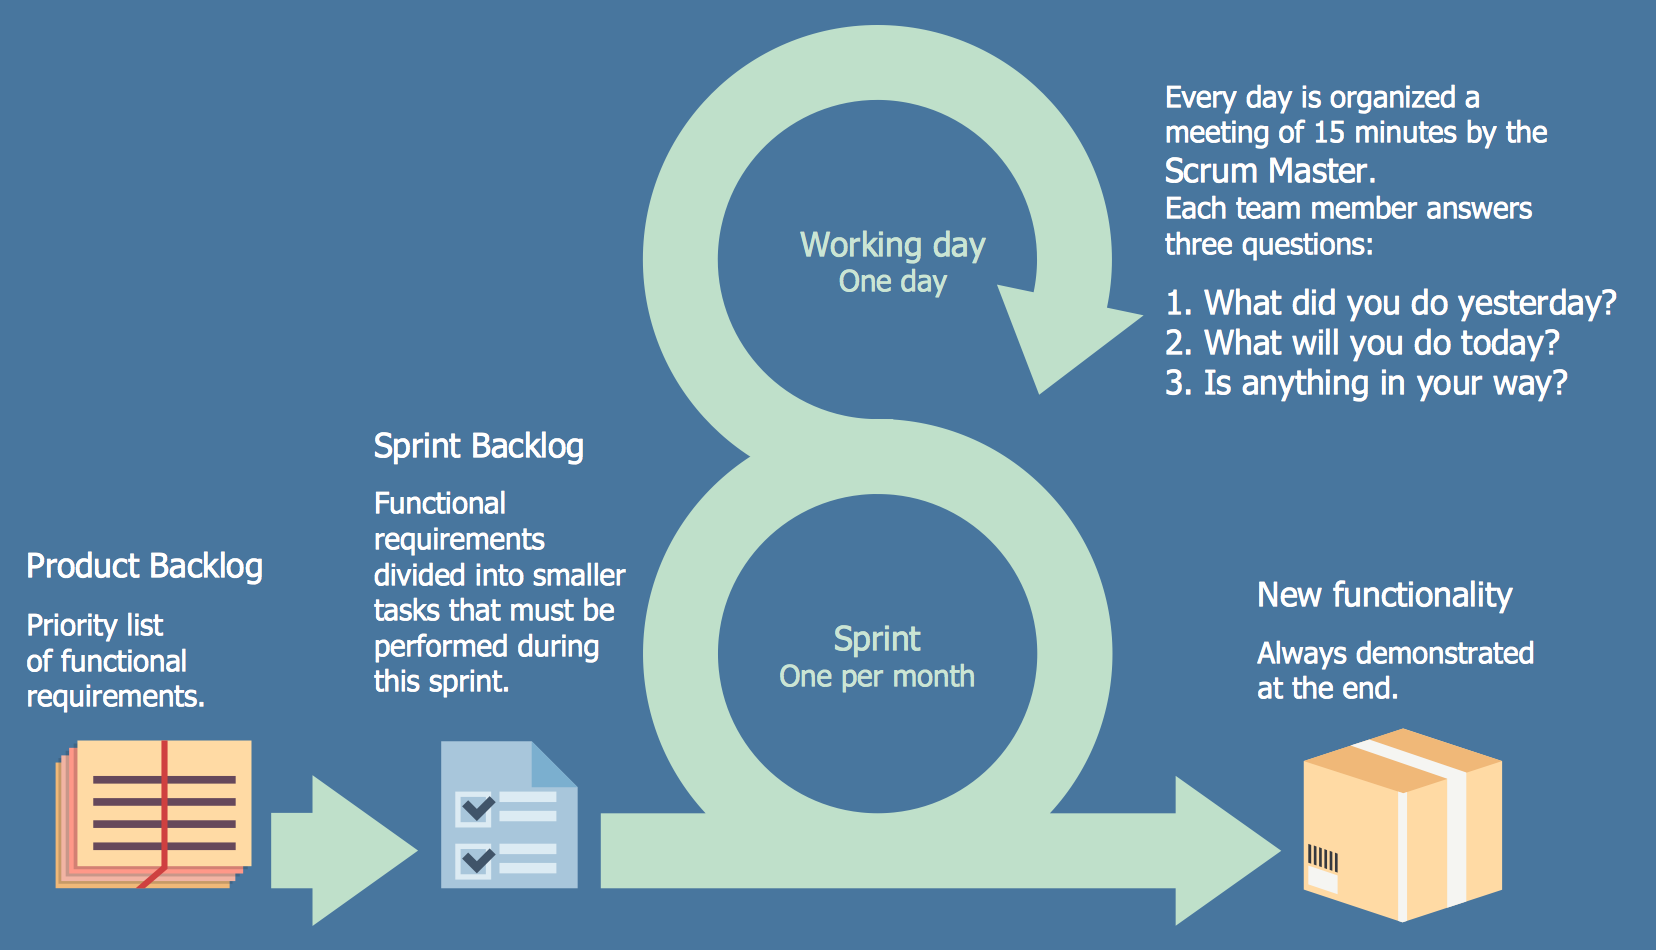
ConceptDraw DIAGRAM diagramming and vector drawing software extended with unique SCRUM Workflow solution from the Project Management area of ConceptDraw Solution Park allows fast and easy design professional-looking Scrum Workflow Diagrams and Scrum workflow scheme for projects required when working on projects and managing them, when developing software with cutting-edge Agile methodologies.Flow Chart
A Flow Chart is a type of diagram which visualizes a process, algorithm of a program or workflow. The steps / operations are represented as boxes of various types and are connected by arrows which show the flow of the process. But how to design a Flow Chart fast and easy? We recommend to use a powerful ConceptDraw DIAGRAM diagramming and vector drawing software extended with Flowcharts Solution from the "Diagrams" Area of ConceptDraw Solution Park.Wireframe Tools
A wireframe is a scheme of a future web page. Wireframe illustrates the web page structure, location and size of the main elements, as well as their interaction with the user. With such scheme designer defines the functionality of the page, not its appearance.Ishikawa Diagram
In almost every sphere of life and work the people time to time are faced with the fact that on their way there are certain obstacles and problems. But it is not always possible to identify the true cause of particular problem. To understand the basic causes of problems and eliminate them, it is convenient to use the chart of Kaoru Ishikawa - the technique specially designed for this. ConceptDraw DIAGRAM diagramming and vector drawing software extended with Fishbone Diagrams solution from the Management area can help you with construction the Fishbone Diagram also known as Ishikawa Diagram. Ishikawa Diagram shows factors of Equipment, Process, People, Materials, Environment and Management, all affecting the overall problem in one drawing for the further analysis. It is a well effective way to analyze the business problems you must identify and solve.Integration Definition
Creation of various types of Integration DEFinition (IDEF) diagrams - IDEF0, IDEF1X, IDEF2, IDEF3 and many other is a sufficiently complex process that requires powerful automated tools. ConceptDraw DIAGRAM diagramming and vector drawing software offers you such tool - IDEF Business Process Diagrams solution from the Business Processes area of ConceptDraw Solution Park.GUI Software
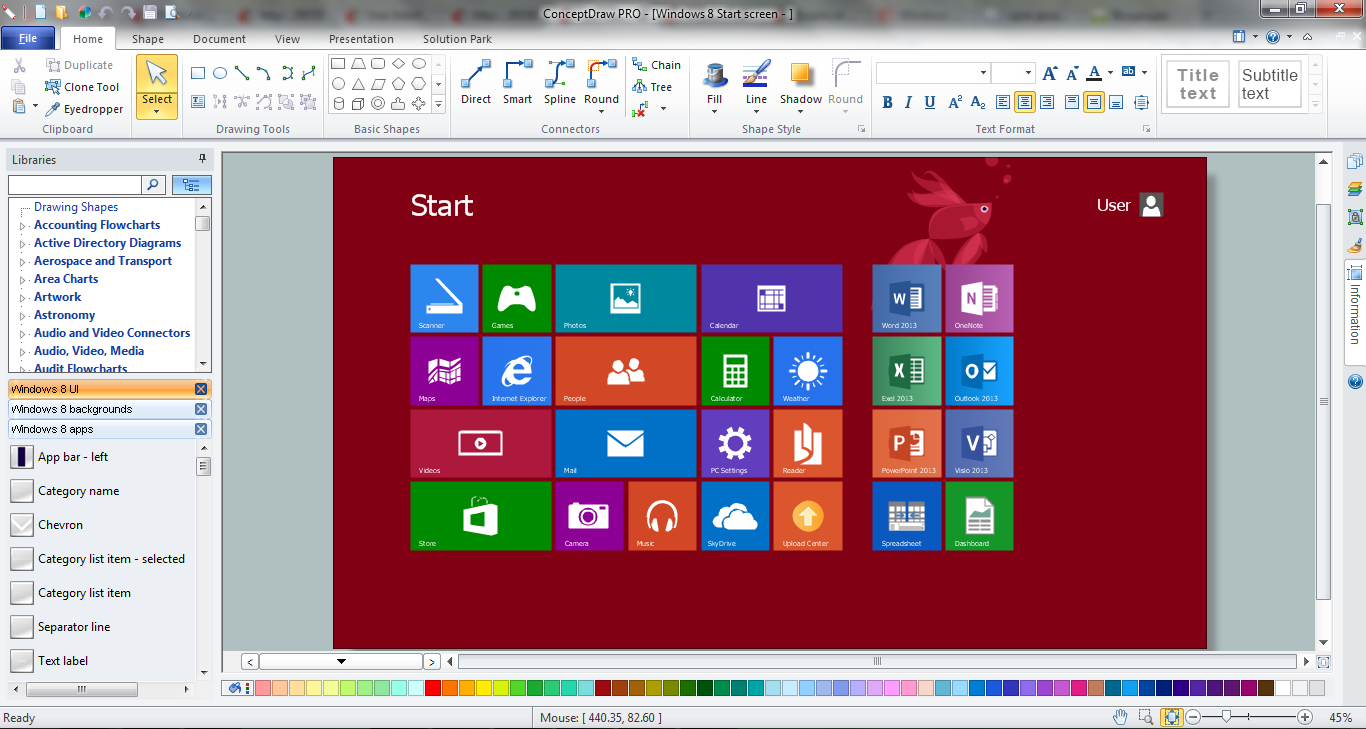
ConceptDraw DIAGRAM diagramming and vector drawing software extended with Windows 8 User Interface Solution is a powerful GUI Software. Designing of professional looking Windows 8 and Windows 8.1 user interfaces, and Windows 8 UI design patterns never been easier than now with convenient and useful tools of Windows 8 User Interface Solution from the Software Development area.Software Flow Chart
Many professionals have to solve problems every day. Designing of the process algorithm contribute to understand where the problem is in the process. A Flowchart is a graphical tool that most usable for breaking down processes. Definition of flowchart - a diagram that shows step-by-step progression through a procedure or system especially using connecting lines and a set of conventional symbols. All the icons, symbols and connectors needed for creating standardized notation flowcharts are contained within Software Flow Chart.
 ATM UML Diagrams
The ATM UML Diagrams solution lets you create ATM solutions and UML examples. Use ConceptDraw DIAGRAM as a UML diagram creator to visualize a banking system.
- HR arrows - Vector stencils library | Interactions - Vector stencils ...
- Icon Cursor Vertical Resize
- White Arrow With Blue Bg Png
- Triangle Back Icon Png White
- Window elements - Vector stencils library | Toolbar control elements ...
- Window elements - Vector stencils library | Mac OS X Lion buttons ...
- Background Blue And White Vector
- Arrows - Vector clipart library | How to Create Presentation of Your ...
- Refresh Icon White Png
- DroidDia PRO unlocker | iPhone User Interface | Window elements ...
- Resizing Pointer Icon
- How to Resize Objects in ConceptDraw PRO
- Window elements - Vector stencils library | OS X 10.10 Yosemite ...
- White Background Hd For Design
- Refresh Button White Png
- Interactions - Vector stencils library | How to Create a Scatter Chart ...
- Interactions - Vector stencils library | MS Windows Vista user ...
- Window elements - Vector stencils library | Window elements ...
- Interactions - Vector stencils library | Interactions - Vector stencils ...
- Window elements - Vector stencils library | Window elements ...
