 ConceptDraw Solution Park
ConceptDraw Solution Park collects graphic extensions, examples and learning materials
Entity Relationship Diagram - ERD - Software for Design Crows Foot ER Diagrams
ER-model is a data model which lets describe the conceptual schemes in a specific subject area. It can help to highlight the key entities and specify relationships that can be established between these entities. During the database design, it is realized the transformation of ER model into certain database scheme based on the chosen data model (relational, object, network, etc.). There are used two notations for ERDs: Crow's Foot and Chen's. Crow's Foot notation proposed by Gordon Everest represents the entity by rectangle containing its name (name must be unique within this model), and relation - by the line which links two entities involved in relationship. The relationship's plurality is graphically indicated by a "plug" on the end of the link, the optionality - by a circle. Entity-Relationship Diagrams based on Crow's Foot notation can be easily drawn using the ConceptDraw PRO. Extended with Entity-Relationship Diagram (ERD) solution, it is the best ERD diagrams software with powerful tools and ready design elements for Crow's Foot and Chen notations.
HelpDesk
How to Create a Data Flow Diagram
Data flow diagramming is a highly effective technique for showing the flow of information through a system. Data flow diagrams reveal relationships among and between the various components in a program or system. DFD is an important technique for modeling a system’s high-level detail by showing how input data is transformed to output results through a sequence of functional transformations. The set of standard symbols is used to depict how these components interact in a system. ConceptDraw PRO allows you to draw a simple and clear Data Flow Diagram using special libraries.
 Cafe and Restaurant Floor Plans
Restaurants and cafes are popular places for recreation, relaxation, and are the scene for many impressions and memories, so their construction and design requires special attention. Restaurants must to be projected and constructed to be comfortable and e
 Data Flow Diagrams (DFD)
Data Flow Diagrams solution extends ConceptDraw PRO software with templates, samples and libraries of vector stencils for drawing the data flow diagrams (DFD).
Bar Diagrams for Problem Solving. Create event management bar charts with Bar Graphs Solution
Create bar charts for event management problem solving and visual data comparison using the ConceptDraw PRO diagramming and vector drawing software extended with the Bar Graphs Solution from the Graphs and Charts area of ConceptDraw Solition Park.Jacobson Use Cases Diagram
The vector stencils library UML Use Case contains specific symbols of the UML notation such as actors, actions, associations and relationships for the ConceptDraw PRO diagramming and vector drawing software. This library is contained in the Rapid UML solution from Software Development area of ConceptDraw Solution Park.Amazon Web Services Diagrams diagramming tool for architecture
Amazon Web Services (AWS) offers the reliable and relatively inexpensive cloud computing services. This is the main reason why many large companies prefer to use the Amazon Cloud to storage and operate the data. ConceptDraw PRO diagramming software enhanced with AWS Architecture Diagrams solution provides the powerful AWS diagramming tools to draw the Amazon architecture diagrams and Amazon Web Services planning diagrams, to develop the Architect infrastructure based on AWS in a few minutes. The AWS Architecture Diagrams solution offers variety of built-in samples and templates for several Amazon Web Services products and resources, a wide range of predesigned and recognizable vector graphic icons used for simple designing the Architecture diagrams. The diagrams created in ConceptDraw PRO are professional-looking, helpful when designing and implementing the AWS infrastructure based systems, useful to communicate design, deployment and topology, and apposite for using in presentations, whitepapers, datasheets, posters, and other technical materials you like.How To use Building Design Software
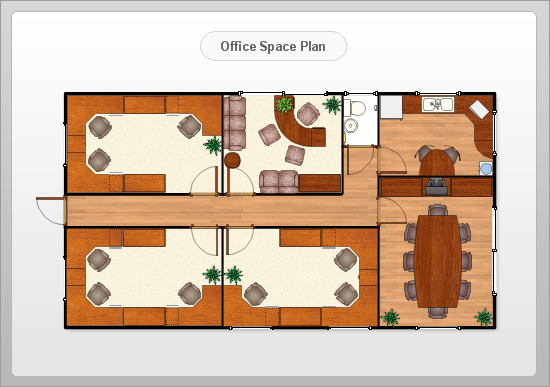
Building Design Software — Drawing facility plans, building plans, store layouts, floor plans, home floor using ConceptDraw PRO.
Flow chart Example. Warehouse Flowchart
Warehouse Flowcharts are various diagrams that describe the warehousing and inventory management processes on the warehouses. Typical purposes of Warehouse Flowcharts are evaluating warehouse performance, measuring efficiency of customer service and organizational performance. This type of Workflow diagrams can be used for identifying any disconnection between business activities and business objectives. They are effectively used by warehouse-related people and organizations, manufacturers, wholesalers, exporters, importers, transporters, and others. Standard Warehousing process flow diagram and standard Workflow diagram are used for process identification for further evaluating effectiveness and profitability of overall business process. Use the ConceptDraw PRO vector graphic software extended with Flowcharts solution to design your own professional-looking Workflow diagrams and Flowcharts of any types, including the Warehouse flowchart, Process flow diagrams which depict in details all steps of Warehouse packages flow. Microsoft Visio, designed for Windows users, can’t be opened directly on Mac. But fortunately, there are several Visio alternatives for Mac which will help Mac users to work Visio files. With ConceptDraw PRO, you may open, edit and save files in Visio format.
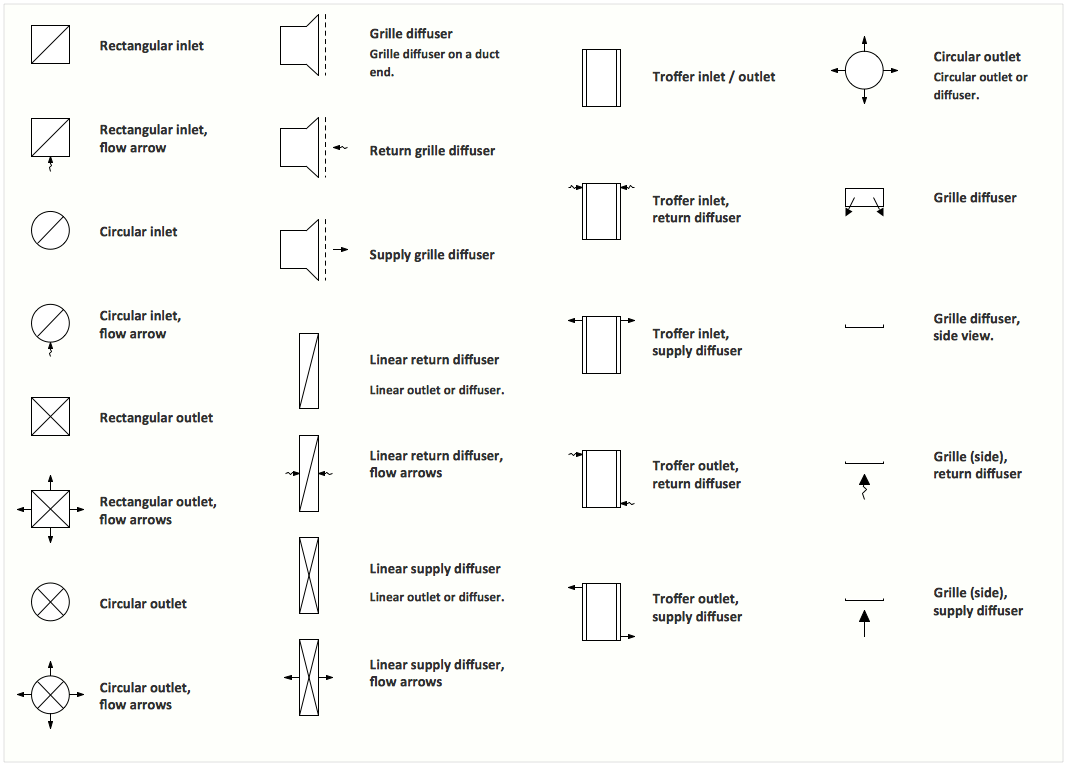
Interior Design Registers, Drills and Diffusers - Design Elements
The interior design project for any home, flat, business center includes the set of different plans and documents, among them obligatory are the ceiling plans. For creation these plans will be convenient to use professional drawing software. It is especially useful in cases when you need create and propose for customer the multiple alternative design plans for choice. ConceptDraw PRO diagramming and vector drawing software extended with Reflected Ceiling Plan solution is the choice of architects, designers, electricians, and other building-related people. It is ideal for displaying the ceiling design ideas which meet any requirements of building and budget. Included templates, samples and especially wide selection of vector design elements, including the elements offered by Registers, Drills and Diffusers library are helpful in drawing without efforts professional-looking Reflected Ceiling plans, Reflective Ceiling plans, Lighting Plans, Electrical Plans, Plans of location the outlets, grilles, diffusers, registers, light fixtures, light panels, etc.Yourdon and Coad Diagram
The vector stencils library Yourdon and Coad Notation from the solution OOAD contains specific symbols of the Yourdon and Coad notation such as data store symbol, data process symbol, loop symbol for ConceptDraw PRO diagramming and vector drawing software. The OOAD solution is contained in the Software Development area of ConceptDraw Solution Park.
 Event-driven Process Chain Diagrams
Event-driven Process Chain (EPC) Diagram is a type of flowchart widely used for modeling in business engineering and reengineering, business process improvement, and analysis. EPC method was developed within the Architecture of Integrated Information Systems (ARIS) framework.
Model Based Systems Engineering
ConceptDraw PRO is a professional diagramming and vector drawing software. Now, enhanced with SysML Solution from the Software Development Area of ConceptDraw Solution Park, ConceptDraw PRO became an ideal software for model based systems engineering (MBSE).- Data Flow Diagrams (DFD) | ConceptDraw Solution Park | Cafe and ...
- Data Flow Diagrams (DFD) | Flowcharts | Cafe and Restaurant Floor ...
- Data Flow Diagrams (DFD) | Systems Engineering | Cafe and ...
- Data Flow Diagrams (DFD) | Cafe and Restaurant Floor Plan ...
- Restaurant For Use Case Diagram And Data Flow Diagram
- Data Flow Diagrams (DFD) | Cisco Network Diagrams | Cafe and ...
- Dfd Diagram For Restaurant Management System In Software
- ConceptDraw Solution Park | Data Flow Diagrams (DFD) | Cafe and ...
- Data Flow Diagrams (DFD) | ConceptDraw Solution Park | Cafe and ...
- ConceptDraw Solution Park | Data Flow Diagrams (DFD) | How to ...
- Data Flow Diagrams (DFD) | Gym and Spa Area Plans | Cafe and ...
- Data Flow Diagrams
- Entity-Relationship Diagram (ERD) | Cafe and Restaurant Floor Plan ...
- Data Flow Diagrams (DFD) | Cafe and Restaurant Floor Plan | Cisco ...
- Entity-Relationship Diagram (ERD) | Data Flow Diagrams (DFD ...
- How to Create a Data Flow Diagram using ConceptDraw PRO | Data ...
- Restaurant Floor Plans Samples | Sample Pictorial Chart . Sample ...
- Restaurant Management System Of Data Flow Diagram For
- ConceptDraw Solution Park | How to Create a Data Flow Diagram ...
- How to Create a Data Flow Diagram using ConceptDraw PRO | Cafe ...
_Win_Mac.png)


