 ConceptDraw Solution Park
ConceptDraw Solution Park collects graphic extensions, examples and learning materials
 25 Typical Orgcharts
The 25 Typical Orgcharts solution contains powerful organizational structure and organizational management drawing tools, a variety of professionally designed organization chart and matrix organization structure samples, 25 templates based on various orga
 Organizational Charts
Organizational Charts solution extends ConceptDraw DIAGRAM software with samples, templates and library of vector stencils for drawing the org charts.
HelpDesk
How to Develop Website Wireframes
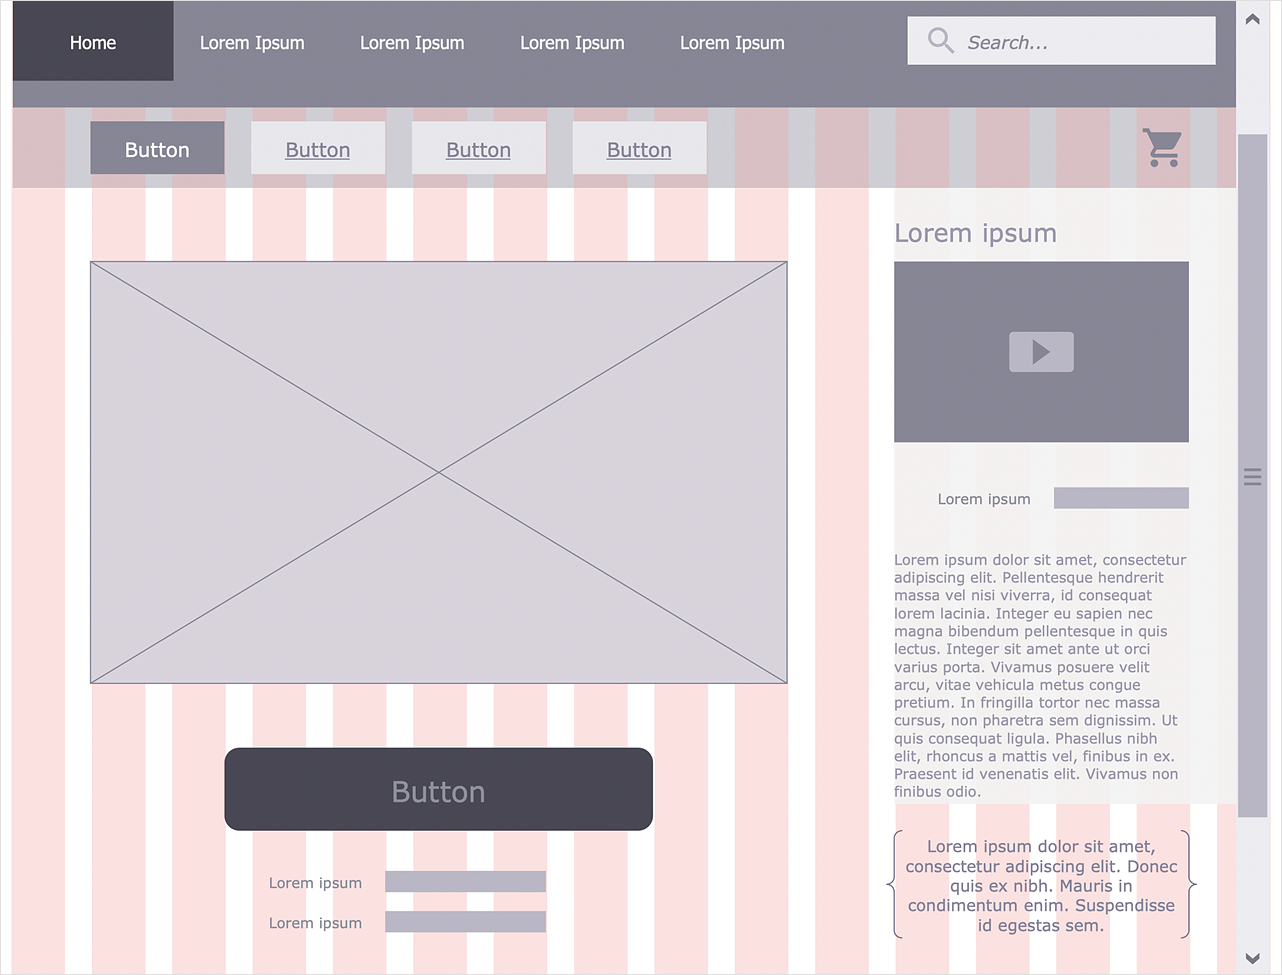
Website design is a rather complicated process. The development of a website wireframe is an important step in any screen design process. The first step of this process before coding can start, a web designer creates a website wireframe — a mock-up for what will be displayed on the screen when navigating through the web site pages. A wireframe design always includes three components: Information design, navigation design, and interface design. The configuration of these components depends on the business model of the website. The Website Wireframing tools provided with ConceptDraw Website Wireframe solution helps to define the information hierarchy of website design, making it easier for web-developers to plan the layout according to how a site visitor has to process the information.
 Bubble Diagrams
Bubble diagrams have enjoyed great success in software engineering, architecture, economics, medicine, landscape design, scientific and educational process, for ideas organization during brainstorming, for making business illustrations, presentations, planning, design, and strategy development. They are popular because of their simplicity and their powerful visual communication attributes.
Software development with ConceptDraw DIAGRAM
Modern software development requires creation of large amount of graphic documentation, these are the diagrams describing the work of applications in various notations and cuts, also GUI design and documentation on project management. ConceptDraw DIAGRAM technical and business graphics application possesses powerful tools for software development and designing technical documentation for object-oriented projects. Solutions included to the Software Development area of ConceptDraw Solution Park provide the specialists with possibility easily and quickly create graphic documentation. They deliver effective help in drawing thanks to the included package of templates, samples, examples, and libraries with numerous ready-to-use vector objects that allow easily design class hierarchies, object hierarchies, visual object-oriented designs, flowcharts, GUI designs, database designs, visualize the data with use of the most popular notations, including the UML and Booch notations, easy manage the development projects, automate projection and development.- ConceptDraw PRO - Organizational chart software | Spider Chart ...
- Create Organizational Chart For Website
- Website Design Flowchart Example
- How To Draw A Website Navigation Map
- Organization chart - Foodbank | Organizational Charts | Create ...
- Basic Flowchart Symbols and Meaning | Cafe and Restaurant Floor ...
- Food Business Organizational Chart
- How To Create Restaurant Floor Plan in Minutes | Column Chart ...
- Process Flowchart | Organizational Structure | Business diagrams ...
- How To Make A Website Chart
- Create An Organizational Chart In Excel
- Best Tool For Diagramming Website Pages
- Make A Chart Draw Computer Parts
- Organizational Chart For Food Business
- ConceptDraw PRO - Organizational chart software | Process ...
- How Do You Do An Org Chart In Excel
- Company website home (wireframe) | Wireframe Examples ...
- How To Create Restaurant Floor Plan in Minutes | Amazon Web ...
- Organizational Chart Using Excel
- Online Org Chart Tool Mac

