This site uses cookies. By continuing to browse the ConceptDraw site you are agreeing to our Use of Site Cookies.

Process Flowchart

The main reason of using Process Flowchart or PFD is to show relations between major parts of the system. Process Flowcharts are used in process engineering and chemical industry where there is a requirement of depicting relationships between major components only and not include minor parts. Process Flowcharts for single unit or multiple units differ in their structure and implementation. ConceptDraw PRO is Professional business process mapping software for making Process flowcharts, Process flow diagram, Workflow diagram, flowcharts and technical illustrations for business documents and also comprehensive visio for mac application. Easier define and document basic work and data flows, financial, production and quality management processes to increase efficiency of your business with ConcepDraw PRO. Business process mapping software with Flowchart Maker ConceptDraw PRO includes extensive drawing tools, rich examples and templates, process flowchart symbols and shape libraries, smart connectors that allow you create the flowcharts of complex processes, process flow diagrams, procedures and information exchange. Process Flowchart Solution is project management workflow tools which is part ConceptDraw Project marketing project management software. Drawing charts, diagrams, and network layouts has long been the monopoly of Microsoft Visio, making Mac users to struggle when needing such visio alternative like visio for mac, it requires only to view features, make a minor edit to, or print a diagram or chart. Thankfully to MS Visio alternative like ConceptDraw PRO software, this is cross-platform charting and business process management tool, now visio alternative for making sort of visio diagram is not a problem anymore however many people still name it business process visio tools.
How To Create a Process Flow Chart (business process modelling techniques)

Flow chart Example. Warehouse Flowchart

Warehouse Flowcharts are various diagrams that describe the warehousing and inventory management processes on the warehouses. Typical purposes of Warehouse Flowcharts are evaluating warehouse performance, measuring efficiency of customer service and organizational performance. This type of Workflow diagrams can be used for identifying any disconnection between business activities and business objectives. They are effectively used by warehouse-related people and organizations, manufacturers, wholesalers, exporters, importers, transporters, and others. Standard Warehousing process flow diagram and standard Workflow diagram are used for process identification for further evaluating effectiveness and profitability of overall business process. Use the ConceptDraw PRO vector graphic software extended with Flowcharts solution to design your own professional-looking Workflow diagrams and Flowcharts of any types, including the Warehouse flowchart, Process flow diagrams which depict in details all steps of Warehouse packages flow. Microsoft Visio, designed for Windows users, can’t be opened directly on Mac. But fortunately, there are several Visio alternatives for Mac which will help Mac users to work Visio files. With ConceptDraw PRO, you may open, edit and save files in Visio format.
ConceptDraw Arrows10 Technology

Flowchart Marketing Process. Flowchart Examples

This sample shows the Flowchart that displays the layout and work flow of the cloud marketing platform. This diagram has a style of the marketing brochure. This style displays the central product that is related to the other issues. Using the ready-to-use predesigned objects, samples and templates from the Flowcharts Solution for ConceptDraw PRO you can create your own professional looking Flowchart Diagrams quick and easy.

Basic Flowchart Examples

ConceptDraw PRO is a business flowchart software includes the wide flowchart examples package.

Purchasing Flowchart - Purchase Order. Flowchart Examples

Create your own flow charts of purchasing business processes using the ConceptDraw PRO diagramming and vector drawing software extended with the Accounting Flowcharts solution from the Finance and Accounting area of ConceptDraw Solution Park. The flow chart example shows the steps of purchasing business process.
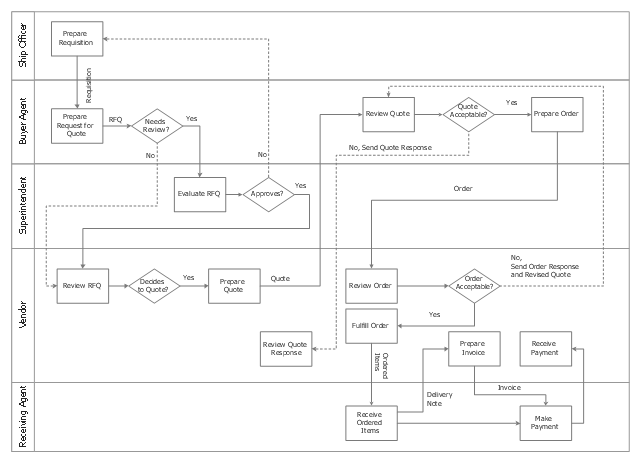
This swim lane diagram sample shows the trading process flow.
"Trade, also called goods exchange economy, is to transfer the ownership of goods from one person or entity to another by getting something in exchange from the buyer. Trade is sometimes loosely called commerce or financial transaction or barter. A network that allows trade is called a market. ...
Modern traders ... generally negotiate through a medium of exchange, such as money. As a result, buying can be separated from selling, or earning. ...
Retail trade consists of the sale of goods or merchandise from a very fixed location, such as a department store, boutique or kiosk, or by mail, in small or individual lots for direct consumption by the purchaser. Wholesale trade is defined as the sale of goods that are sold merchandise to retailers, to industrial, commercial, institutional, or other professional business users, or to other wholesalers and related subordinated services." [Trade. Wikipedia]
The swimlane diagram example "Process flowchart - Trading process" was created using the ConceptDraw PRO diagramming and vector drawing software extended with the Process Flowcharts solution from the Business Processes area of ConceptDraw Solution Park.
Swim lane diagram
Swim lane diagram, swim lanes, horizontal swimlanes, process, decision,

Example of DFD for Online Store (Data Flow Diagram) DFD Example

Data Flow Diagram (DFD) is a methodology of graphical structural analysis and information systems design, which describes the sources external in respect to the system, recipients of data, logical functions, data flows and data stores that are accessed. DFDs allow to identify relationships between various system's components and are effectively used in business analysis and information systems analysis. They are useful for system’s high-level details modeling, to show how the input data are transformed to output results via the sequence of functional transformations. For description of DFD diagrams are uses two notations — Yourdon and Gane-Sarson, which differ in syntax. Online Store DFD example illustrates the Data Flow Diagram for online store, the interactions between Customers, Visitors, Sellers, depicts User databases and the flows of Website Information. ConceptDraw PRO enhanced with Data Flow Diagrams solution lets you to draw clear and simple example of DFD for Online Store using special libraries of predesigned DFD symbols.
Steps to Creating a Sales Process Flow Chart

Cross-Functional Flowchart

Use of Cross-Functional Flowchart is a clear way of showing each team member’s responsibilities and how processes get shared or transferred between different responsible people, teams and departments. Use the best flowchart maker ConceptDraw PRO with a range of standardized cross-functional flowchart symbols to create the Cross-Functional Flowcharts simply and to visualize the relationship between a business process and the functional units responsible for that process. To draw the most quickly Cross-Functional Flowcharts, Cross Functional Process Maps, or Cross Functional Process Flow Diagrams, start with a Cross-functional flowchart samples and templates from ConceptDraw Solution Park. The ConceptDraw Arrows10 and RapidDraw technologies will be also useful for you in drawing. ConceptDraw PRO supports designing both types - horizontal and vertical Cross-functional flowcharts. A vertical layout makes the accents mainly on the functional units while a horizontal layout - on the process. If you need a Visio alternative in Mac OS X, try ConceptDraw PRO. Its interface is very intuitive and it’s actually much easier to use than Visio, yet somehow it’s just as powerful if not more so. ConceptDraw PRO performs professional quality work and seamless Visio interaction.
How to Draw a Cross Functional Flowchart using visio alternative ConceptDraw PRO as visio for mac
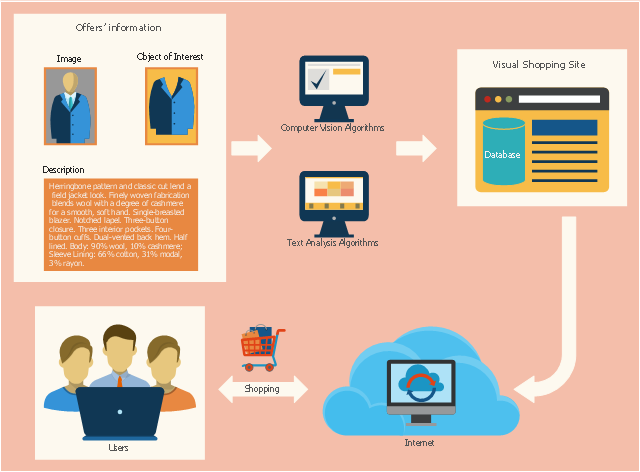
This sales flowchart example was redesigned from the Wikimedia Commons file: Visual shopping scheme.pdf. [commons.wikimedia.org/ wiki/ File:Visual_ shopping_ scheme.pdf]
"Online shopping (sometimes known as e-tail from "electronic retail" or e-shopping) is a form of electronic commerce which allows consumers to directly buy goods or services from a seller over the Internet using a web browser. Alternative names are: e-web-store, e-shop, e-store, Internet shop, web-shop, web-store, online store, online storefront and virtual store. Mobile commerce (or m-commerce) describes purchasing from an online retailer's mobile optimized online site or app." [Online shopping. Wikipedia]
The example "Visual shopping scheme" was created using the ConceptDraw PRO diagramming and vector drawing software extended with the Sales Flowcharts solution from the Marketing area of ConceptDraw Solution Park.
Online shopping flowchart
Online shopping flowchart, web page, user, synchronization, right arrow, product database, man figure, business man, landing page, full shopping cart, empty shopping cart, double headed arrow, database, customer, man, man torso, cloud, clerk, man, man torso, bent arrow,

Target Diagram

Target Diagram is a convenient and visual way of presentation information which is popular and widely used in marketing, business and economics. ConceptDraw PRO diagramming and vector drawing software extended with Target and Circular Diagrams solution from the Marketing area of ConceptDraw Solution Park is ideal for fast and easy drawing a Target Diagram.