 Sales Dashboard
Sales Dashboard solution extends ConceptDraw DIAGRAM software with templates, samples and library of vector stencils for drawing the visual dashboards of sale metrics and key performance indicators (KPI).
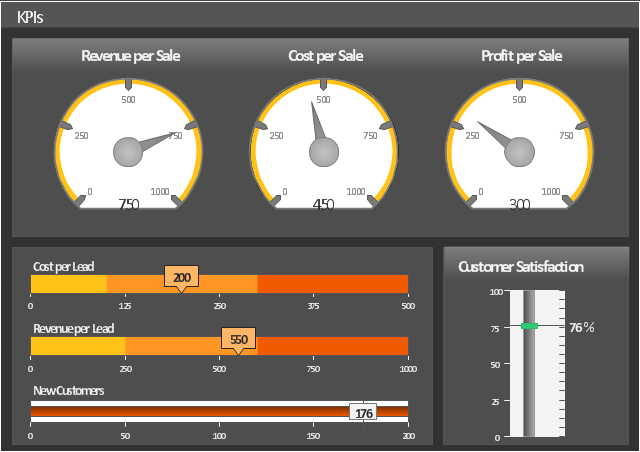
This sales KPIs dashboard sample indicates sale group effectiveness by different parameters, such as Revenue per Sale, Cost per Sale, Profit per Sale, Customer Satisfaction, Cost per Lead and Revenue per Lead using gauge and slider indicators.
The performance dashboard example "Sales KPIs" was created using the ConceptDraw PRO diagramming and vector drawing software extended with the Sales Dashboard solution from the Marketing area of ConceptDraw Solution Park.
The performance dashboard example "Sales KPIs" was created using the ConceptDraw PRO diagramming and vector drawing software extended with the Sales Dashboard solution from the Marketing area of ConceptDraw Solution Park.
Sales dashboard
 Sales Dashboard
Sales Dashboard solution extends ConceptDraw DIAGRAM software with templates, samples and library of vector stencils for drawing the visual dashboards of sale metrics and key performance indicators (KPI).
 Logistic Dashboard
The powerful tools of Logistic Dashboard solution and specially developed live graphic objects of logistic icons, logistic navigation elements, logistic indicators, logistic charts and logistic maps effectively assist in designing Logistic dashboards, Logistic maps, Logistic charts, diagrams and infographics. The included set of prebuilt samples and quick-start templates, demonstrates the power of ConceptDraw DIAGRAM software in logistics management, its assisting abilities in development, realization and analyzing the logistic processes, as well as in perfection the methods of logistics management.
KPI Dashboard

This sales performance dashboard example includes KPIs indicators and business metrics charts: bullet indicator - "Win Ratio vs. Last Year", gauge (speedometer) indicators - "Open Deals vs. Last Year" and "YTD Sales vs. Last Year", column chart - "Leads created", line chart - "Opportunities Won", alarm indicators - "Sales Ratios", horizontal bar chart - "Top Products in Revenue".
The example "Sales performance dashboard" was created using the ConceptDraw PRO diagramming and vector drawing software extended with the Sales Dashboard solution from the Marketing area of ConceptDraw Solution Park.
www.conceptdraw.com/ solution-park/ marketing-sales-dashboard
The example "Sales performance dashboard" was created using the ConceptDraw PRO diagramming and vector drawing software extended with the Sales Dashboard solution from the Marketing area of ConceptDraw Solution Park.
www.conceptdraw.com/ solution-park/ marketing-sales-dashboard
Sales dashboard

 Meter Dashboard
Meter dashboard solution extends ConceptDraw DIAGRAM software with templates, samples and vector stencils library with meter indicators for drawing visual dashboards showing quantitative data.
 Business Process Model and Notation
Business Process Model and Notation Solution for ConceptDraw DIAGRAM is helpful for modeling the business processes of any degree of complexity, documenting them and effective creating diagrams using the BPMN 2.0 standard.
Business Diagram Software


 Business and Finance
Use Business and Finance solution to make professional-looking documents, presentations and websites, business, finance, advertising, and project management illustrations, or any designs that requires clipart of currency, office, business, advertising, management, marketing, people, time, post, contacts, collaboration, etc.
 Seven Basic Tools of Quality
Manage quality control in the workplace, using fishbone diagrams, flowcharts, Pareto charts and histograms, provided by the Seven Basic Tools of Quality solution.
- Cost Revenue Dashboard
- Sales Dashboard | Sales Dashboard | Dashboard | Revenue ...
- Revenue Dashboard Examples
- Sales metrics and KPIs - Visual dashboard | Sales KPIs ...
- Sales KPIs - Performance dashboard | Sales Dashboard | Sales ...
- Logistics Performance Dashboard - Template | Sales KPIs ...
- Website KPIs - Visual dashboard | A KPI Dashboard | Sales KPIs ...
- A KPI Dashboard | A KPI Dashboard Provides the Answers Your ...
- KPIs and Metrics | The Facts and KPIs | KPI Dashboard | Kpis
- KPIs and Metrics | A KPI Dashboard | Sales KPI Dashboards ...
- Meter Dashboard | Design elements - Sales dashboard | Design ...
- Sales performance dashboard | Design elements - Sales KPIs and ...
- Design elements - Meter indicators | Sales metrics and KPIs - Visual ...
- Sales metrics and KPIs - Visual dashboard | Sales dashboard ...
- Sales performance dashboard | KPIs and Metrics | Design elements ...
- Actual Sales Vs Plan Dashboard
- Sales dashboard - Vector stencils library | Sales dashboard - Vector ...
- A KPI Dashboard
- What is a KPI? | KPI Dashboard | Performance Indicators | Kpi ...