PDPC
ConceptDraw PRO extended with Seven Management and Planning Tools Solution from the Management Area of ConceptDraw Solution Park is the best software for drawing all types of diagrams from the Seven Management and Planning Tools: Affinity Diagram, Relations Diagram, Prioritization Matrix, Root Cause Analysis Tree Diagram, Involvement Matrix, PERT Chart, and Risk Diagram (PDPC).The Best Flowchart Software Available
ConceptDraw gives the ability to draw Flowchart documents. Flowcharts solutionis a powerful tool that extends ConceptDraw application for drawing business flowcharts.ConceptDraw PRO vector diagramming and business graphics software enhanced with with templates, green and interactive flowchart makers, samples and stencil libraries from ConceptDraw Solution Park which all focused to help with drawing flowcharts, block diagrams, bar charts, histograms, pie charts, divided bar diagrams, line graphs, area charts, scatter plots, circular arrows diagrams, Venn diagrams, bubble diagrams, concept maps, and others.

 Seven Management and Planning Tools
Seven Management and Planning Tools solution extends ConceptDraw PRO and ConceptDraw MINDMAP with features, templates, samples and libraries of vector stencils for drawing management mind maps and diagrams.
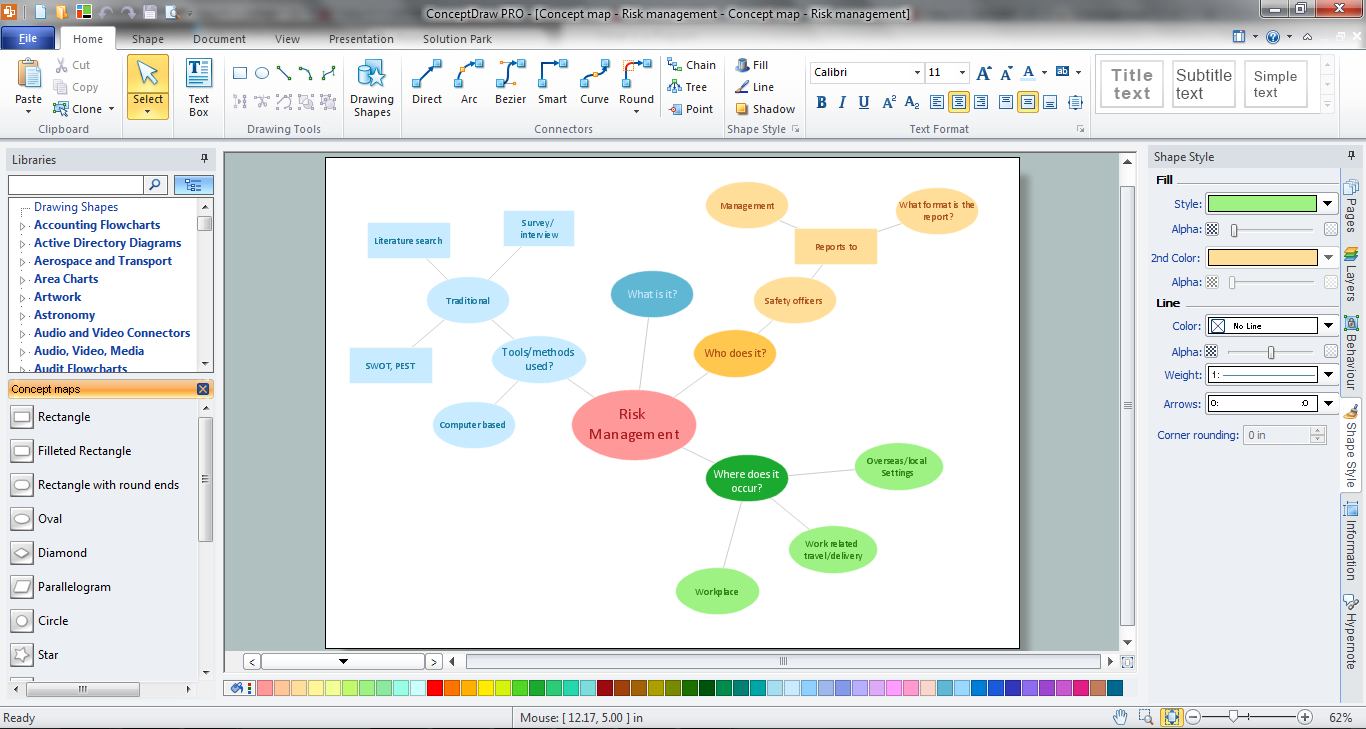
How To Make a Concept Map
How to make a Concept Map fast and easy? ConceptDraw PRO diagramming and vector drawing software extended with Concept Maps Solution from the "What is a Diagram" Area is the best choice for those who want design professional looking Concept Map in minutes.Systems Engineering
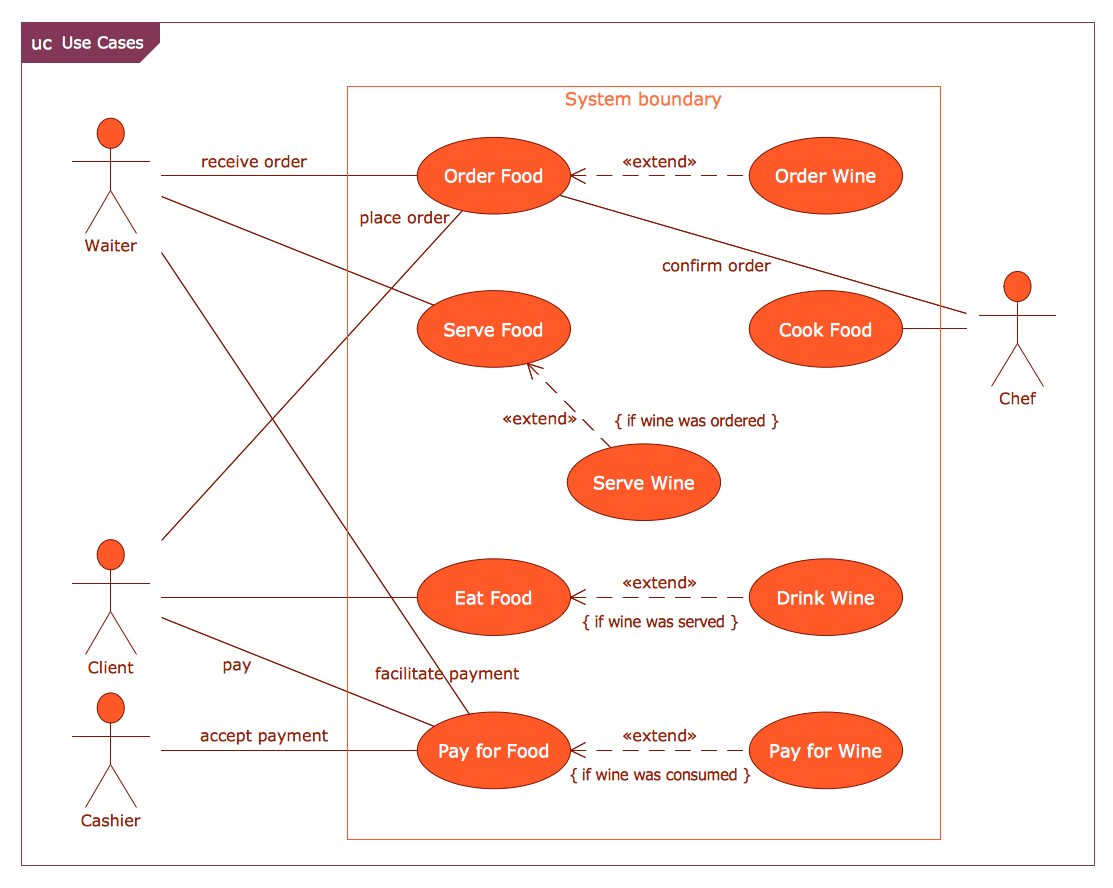
Systems engineering is an interdisciplinary field of engineering that focuses on how to design and manage complex engineering systems over their life cycles.ConceptDraw PRO supplied with SysML Solution from the Software Development Area of ConceptDraw Solution Park is a powerful and effective systems engineering software.
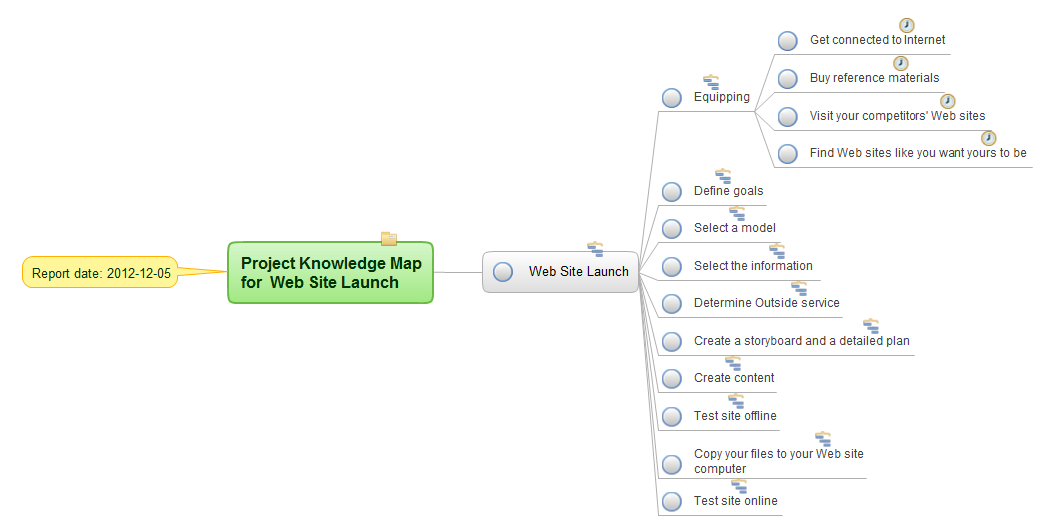
How To Use Collaboration Tool in Project Management
Collaboration tool for project management enables you to give a new role to knowledge management and document sharing within your team.
Definition TQM Diagram
The Total Quality Management Diagram solution helps your organization visualize business and industrial processes. Create Total Quality Management diagrams for business process with ConceptDraw software.Decision Making
Decision Making - ConceptDraw Office suite provides visual tools that are given support on the stage of the decision making.The Seven Management and Planning Tools is a set for such diagrams: Affinity Diagram, Relations Diagram, Prioritization Matrix, Root Cause Tree Diagram, Involvement Matrix, PERT Chart, Risk Diagram (PDPC).

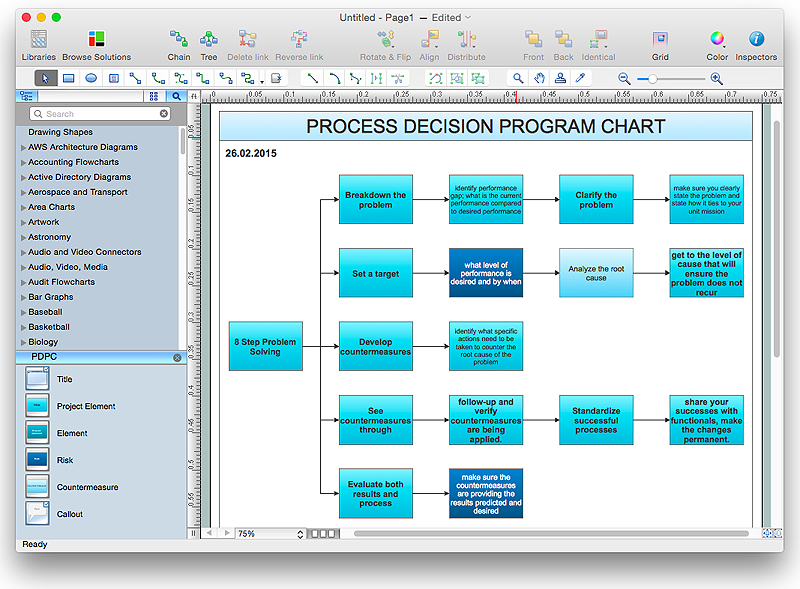
CORRECTIVE ACTIONS PLANNING. Risk Diagram (PDPC)
Risk Diagram (PDPC) - ConceptDraw Office suite is a software for Risks Diagram making. This diagram identifies possible risks in accomplishing corrective actions. With the Risks Diagram, one analyzes each action separately in a tree of all actions and develops a preventive action in response of each potential obstacles or circumstances which may be a risk.
CORRECTIVE ACTIONS PLANNING. PERT Chart
The PERT Chart is constructed as part of the process in creating a schedule of corrective actions. The PERT Chart shows the logical connections and consequence of tasks to be performed. It displays the time period for problem solving and the implementation of all activities through the critical path.ConceptDraw Office suite is a software for corrective actions planning.

HelpDesk
How To Create Risk Diagram (PDPC)
Article on how to identify possible risks when carrying out corrective actions, and define preventive actions
PROBLEM ANALYSIS. Root Cause Analysis Tree Diagram
Root Cause Analysis Tree Diagram. Use the Root Cause Diagram to perform visual root cause analysis. Root Cause Analysis Tree Diagram is constructed separately for each highly prioritized factor. The goal of this is to find the root causes for the factor and list possible corrective action.ConceptDraw Office suite is a software for problem analysis.

Credit Card Order Process Flowchart. Flowchart Examples
This sample was created in ConceptDraw PRO diagramming and vector drawing software using the Flowcharts solution from the What is a Diagram area of ConceptDraw Solution Park.This sample shows the Flowchart of the Credit Card Order Process. On this diagram are used the flowchart symbols that represents the processes and documents. The flowchart symbols are connected with arrows.
Example of Flowchart Diagram
ConceptDraw - feature-rich flowchart software. This software includes flowchart diagram examples set. Libraries contain vector stencils that allow users to use RapidDraw technology. Users can start draw their own flowchart diagrams from existing examples by clicking on direction arrows.- Risk Management Strategies Examples
- Sample Risk Management Plan Template Chart
- Value Stream Mapping | Business Tools Perceptual Mapping | Risk ...
- Risk Management Concept Diagram
- Management | Concept map - Risk management | Seven ...
- Risk management - Concept map | How To Make a Concept Map ...
- Block Diagram Of Risk Management
- CORRECTIVE ACTIONS PLANNING. Risk Diagram (PDPC) | How ...
- Risk management - Concept map | Concept Maps | The Best ...
- It Security Risks
- Concept Map Risk Management
- Fishbone Diagram | Seven Management and Planning Tools ...
- Prioritization matrix - Health care problems | Seven Management ...
- Seven Management and Planning Tools | How to Manage Problem ...
- Seven Management and Planning Tools | Property Management ...
- Software development with ConceptDraw Products | Risk ...
- Seven Management And Planning Tools Examples
- CORRECTIVE ACTIONS PLANNING. Risk Diagram (PDPC) | Risk ...
- Information Security Risk


