 Seven Basic Tools of Quality
Manage quality control in the workplace, using fishbone diagrams, flowcharts, Pareto charts and histograms, provided by the Seven Basic Tools of Quality solution.
In searching of alternative to MS Visio for MAC and PC with ConceptDraw DIAGRAM
Undoubtedly MS Visio is a powerful and multifunctional tool, but however at times occur the instances, when it turns unable of meeting certain users' requirements. At this cases you may need to use an alternative program software, preferably it will be simple, convenient, and at the same time powerful and professional. In searching the alternative to MS Visio for MAC and PC we recommend you to pay attention for ConceptDraw DIAGRAM software, which was developed to satisfy all your drawing needs and requirements. It is a fully-functioned alternative product to MS Visio for both platforms. ConceptDraw DIAGRAM software has many advantages, the main among them are the cross-platform compatibility, a reasonable price, widespread ConceptDraw Solution Park with huge variety of different solutions that offer numerous libraries of specialized vector objects, useful examples, samples, and quick-start templates, extensive import / export capabilities, built-in script language, MS Visio support and certainly free technical support.HelpDesk
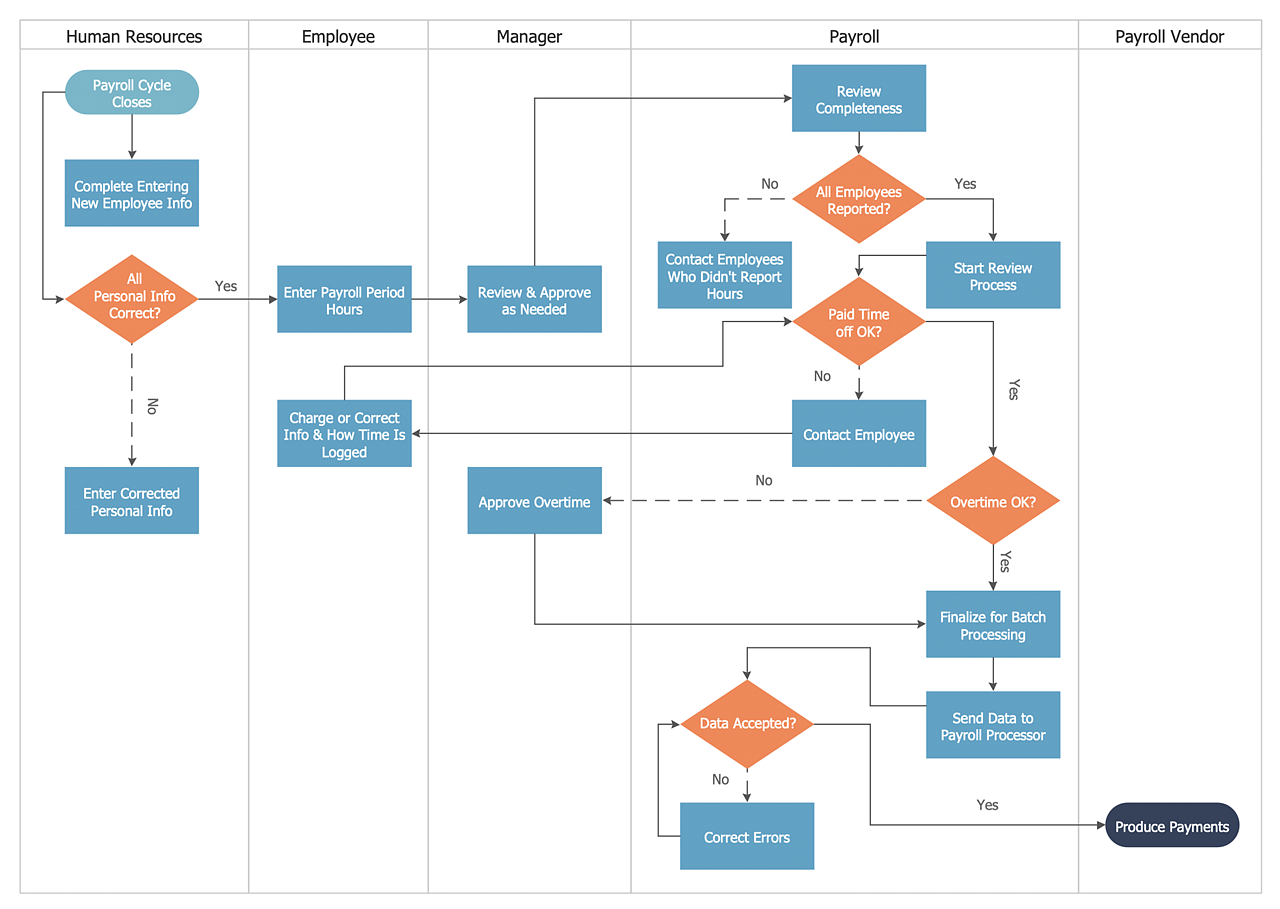
How to Create a Cross-Functional Flowchart Using ConceptDraw Solution
A cross-functional process is a process that involves multiple divisions, each of which makes its part of the entire company workflow. For example product development, lead management, client orders processing – and other critical processes. Using a Cross-Functional flowchart is a clear way of showing each team member’s responsibilities and how processes get shared or transferred between different teams and departments. The Cross-Functional flowchart is a clear way to visualize the document flow in your organization. The ability to create Cross-functional diagrams is provided by the Cross-Functional Flowcharts solution.- Process Flowchart | Basic Flowchart Symbols and Meaning | Cross ...
- Run Flow Chart
- Basic Flowchart Symbols and Meaning | Process Flowchart | Cross ...
- Affinity Diagram Block Diagram Flow Chart Run Chart Pdf
- Data Flow Diagram Symbols . DFD Library | Process Flowchart ...
- Basic Flowchart Symbols and Meaning | Process Flowchart | Cross ...
- Process Flowchart | Winter Olympics - Bobsleigh | Star Network ...
- Process Flowchart | Basic Flowchart Symbols and Meaning | Types ...
- Basic Flowchart Symbols and Meaning | Basic Audit Flowchart ...
- Swim Lane Flowchart Symbols | Cross-Functional Flowchart (Swim ...
- Account Flowchart . Flowchart Examples
- Flow Chart Of Pay Run
- Flowchart | Sales steps - Vector stencils library | People Run Pictogram
- Design elements - Run chart | Nursing department finance | Seven ...
- Basic Flowchart Symbols and Meaning | Flow Chart Symbols ...
- Top 5 Android Flow Chart Apps | Sales Process Flowchart Symbols ...
- Cloud round icons - Vector stencils library | Flowchart Example : Flow ...
- Process Flowchart | Types of Flowcharts | Structured Systems ...
- Basic Flowchart Symbols and Meaning | Process Flowchart ...
- Process Flowchart | TQM Software — Build Professional TQM ...

