The vector stencils library "Sales workflow" contains 39 sales workflow symbols.
Use these sales icon set to draw your sales flowcharts, workflow diagrams and process charts with the ConceptDraw PRO diagramming and vector drawing software.
The sales pictograms library "Sales workflow" is included in the Sales Flowcharts solution from the Marketing area of ConceptDraw Solution Park.
Sales Process Management
Sales process management is a business discipline which focuses on the development and practical application of various sales techniques, and on the management of sales operations of the company.It is effective to use professional software for the sales process management. ConceptDraw DIAGRAM diagramming and vector drawing software extended with Sales Flowcharts solution from the Marketing area of ConceptDraw Solution Park is the best choice.
Customer Relationship Management
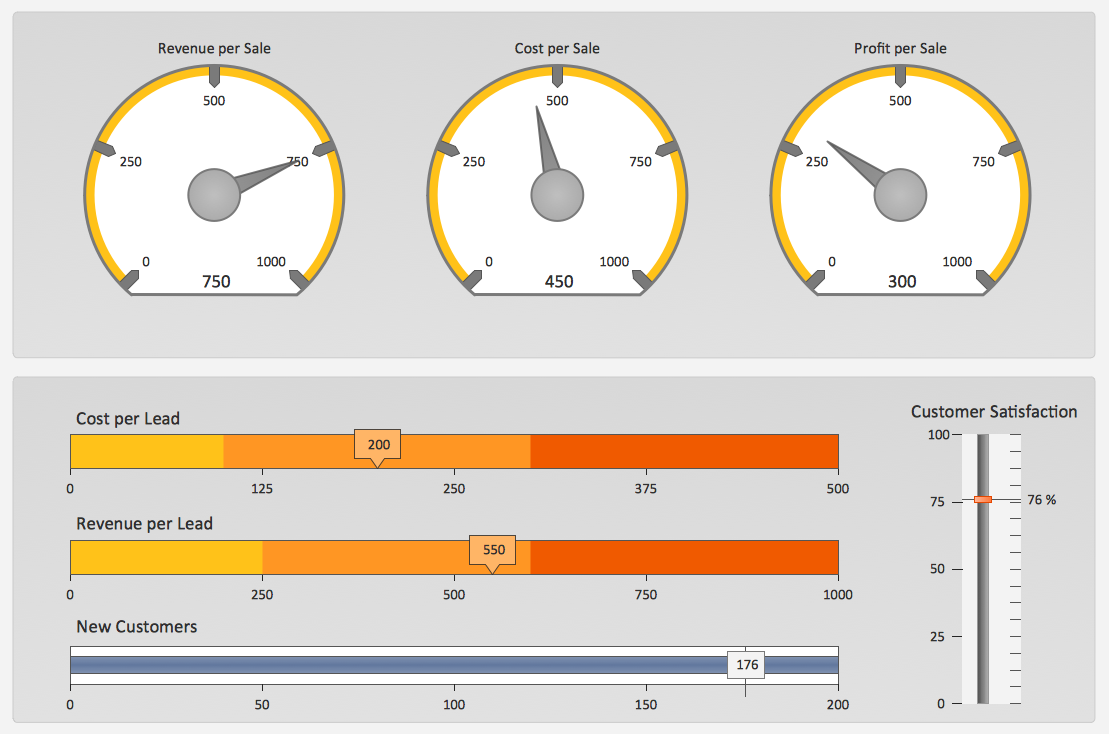
Customer relationship management is an important component of sales success. Visualizing sales data you may put some KPI related to customers relationship management to your Sales dashboard and track this important aspect in real time.This sales manager dashboard example includes KPIs graphic indicators and business metrics charts: gauge (speedometer) indicators - "YTD Sales vs. Last Year", "Net Sales vs. Last Year", "YTD Returns vs. Last Year", "Product Inventory", bullet indicators - "Performance vs. Quota", line chart - "Weekly Sales", pie chart - "Purchases by Region".
The performance dashboard example "Sales manager dashboard" was created using the ConceptDraw PRO diagramming and vector drawing software extended with the Sales Dashboard solution from the Marketing area of ConceptDraw Solution Park.
www.conceptdraw.com/ solution-park/ marketing-sales-dashboard
The performance dashboard example "Sales manager dashboard" was created using the ConceptDraw PRO diagramming and vector drawing software extended with the Sales Dashboard solution from the Marketing area of ConceptDraw Solution Park.
www.conceptdraw.com/ solution-park/ marketing-sales-dashboard
The vector stencils library "Sales workflow" contains 39 sales workflow symbols.
Use these sales icon set to draw your sales flowcharts, workflow diagrams and process charts with the ConceptDraw PRO diagramming and vector drawing software.
The sales pictograms library "Sales workflow" is included in the Sales Flowcharts solution from the Marketing area of ConceptDraw Solution Park.
Use these sales icon set to draw your sales flowcharts, workflow diagrams and process charts with the ConceptDraw PRO diagramming and vector drawing software.
The sales pictograms library "Sales workflow" is included in the Sales Flowcharts solution from the Marketing area of ConceptDraw Solution Park.
Sales Dashboard
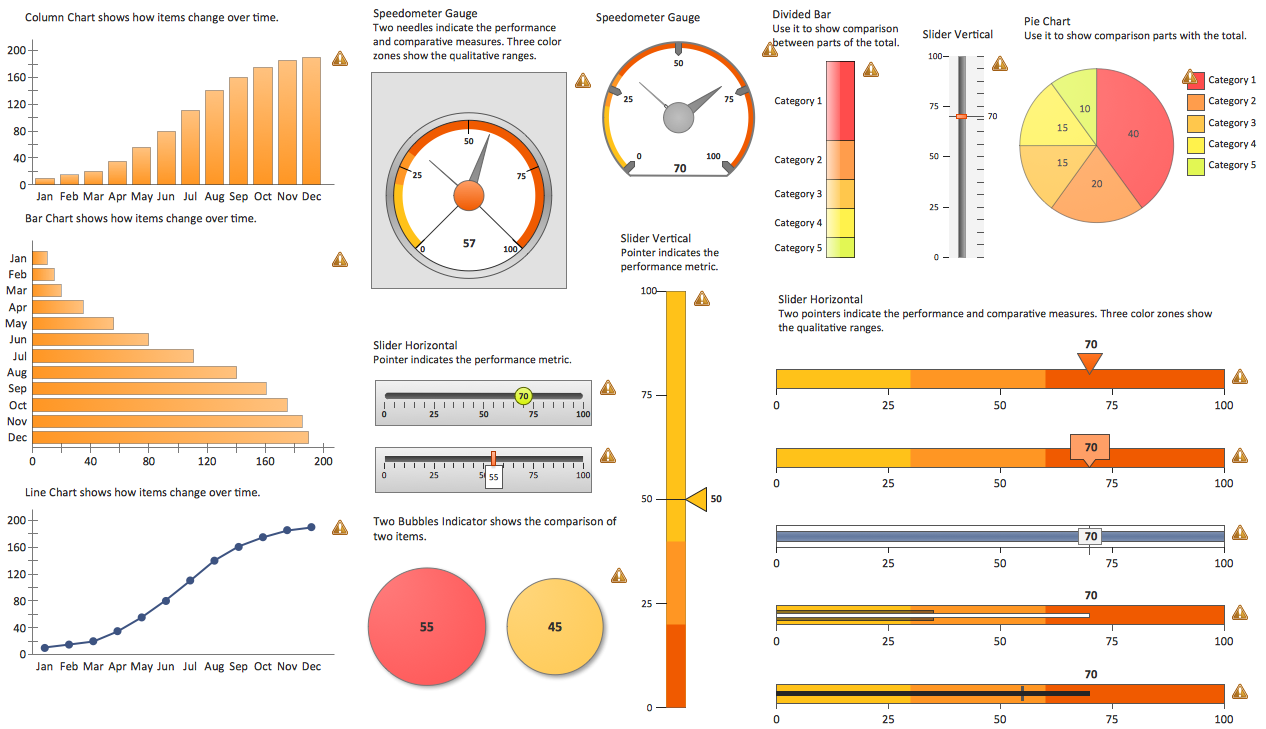
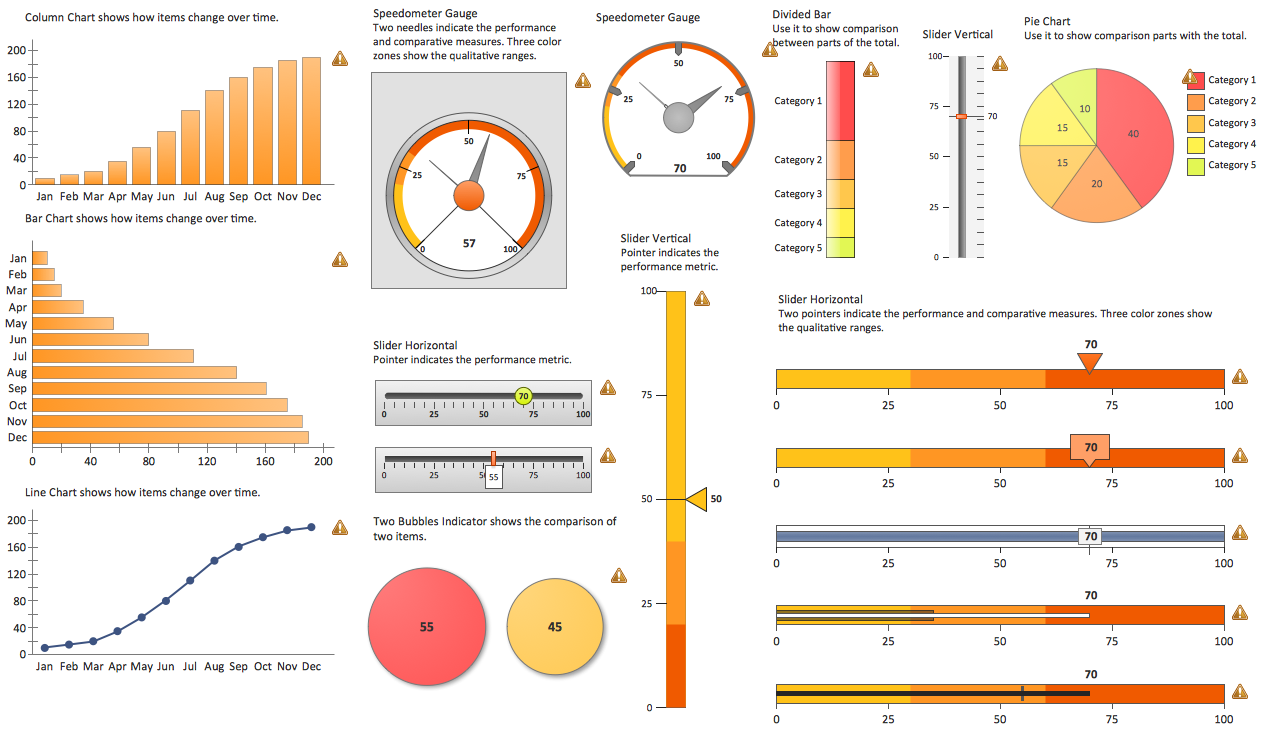
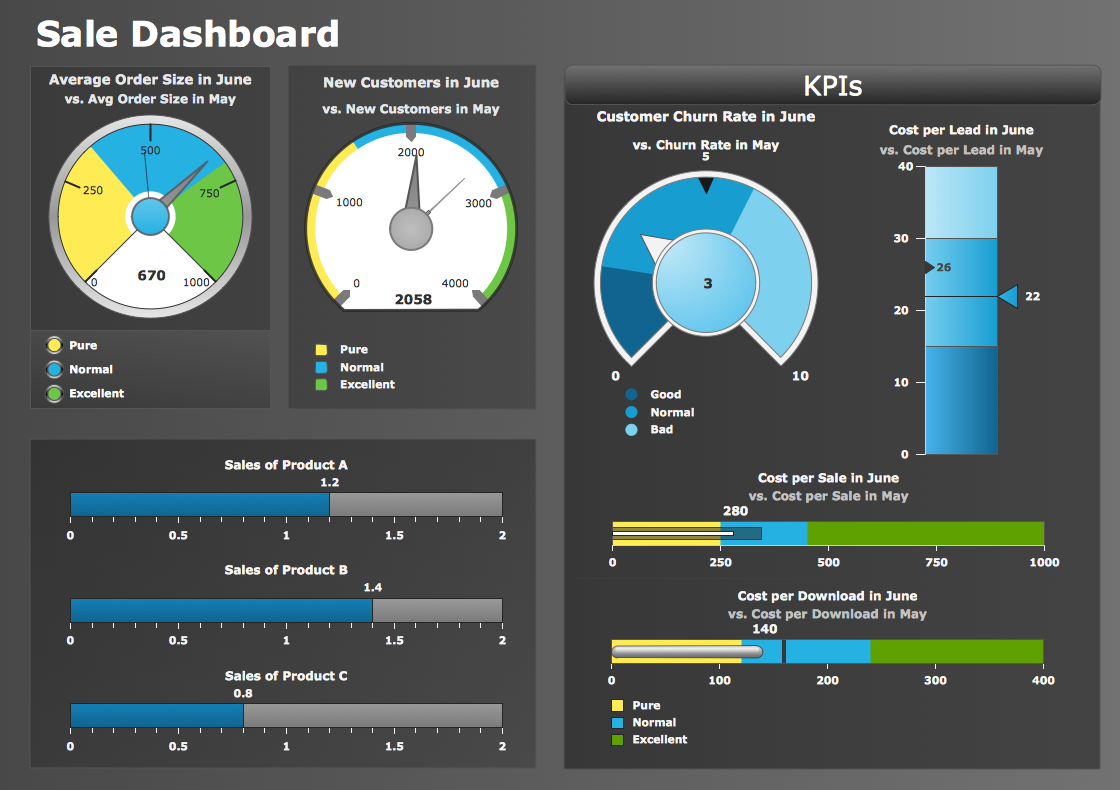
Sales Dashboard solution extends ConceptDraw DIAGRAM software with templates, samples and library of vector stencils for drawing the visual dashboards of sale metrics and key performance indicators (KPI).
This flowchart example was created on the base of land sales process diagram from the Property management webpage of the VicRoads website.
[www.vicroads.vic.gov.au/ planning-and-projects/ property-services/ property-management]
"VicRoads or the Roads Corporation of Victoria is a statutory corporation which is the state road and traffic authority in the state of Victoria, Australia. It is responsible for maintenance and construction of the state arterial road network, as well as driver licensing and vehicle registration. VicRoads has broad responsibility for road safety policy and research. It is also responsible for regulating the accident towing industry in Victoria." [VicRoads. Wikipedia]
"Sales Process.
Once it has been established with the relevant VicRoads Regions/ Projects and other business areas that properties are identified as surplus to VicRoads’ operational needs, they are incorporated in the VicRoads annual sales program.
Following approval: relevant VicRoads Regional Manager and the VicRoads Chief Executive (and in some circumstances Minster for Public Transport and Roads) must approve all land deemed surplus and available for disposal.
The method of sale is then determined and consultant advice is sought:
(1) Planning.
(2) Valuer General Victoria (Valuer General’s office must provide a valuation for all sales).
(3) Government Land Monitor (Land Monitor approval is sought if the value exceeds $750,000).
(4) Environmental.
(5) Local Council." [www.vicroads.vic.gov.au/ planning-and-projects/ property-services/ property-management]
The example "Land sales process flowchart" was created using the ConceptDraw PRO diagramming and vector drawing software extended with the Sales Flowcharts solution from the Marketing area of ConceptDraw Solution Park.
The vector stencils library "Sales workflow" contains 39 sales workflow symbols.
Use these sales icon set to draw your sales flowcharts, workflow diagrams and process charts with the ConceptDraw PRO diagramming and vector drawing software.
The sales pictograms library "Sales workflow" is included in the Sales Flowcharts solution from the Marketing area of ConceptDraw Solution Park.
Use these sales icon set to draw your sales flowcharts, workflow diagrams and process charts with the ConceptDraw PRO diagramming and vector drawing software.
The sales pictograms library "Sales workflow" is included in the Sales Flowcharts solution from the Marketing area of ConceptDraw Solution Park.
Sales Process FlowchartFlowchart Examples
Sales Process Flowchart is an invaluable tool for business. It gives you opportunity to visualise and better understand the sales process, reveal and also visually highlight issues or bottlenecks, and predict the number of sales. The Flowchart is ideal method to represent in details all steps of the process, tasks and decisions needed to obtain maximum effectiveness and success. The steps are graphically represented by boxes linked with arrows indicating direction of the workflow, decision is shown by diamond. The sales process is closely linked to the company's success and usually includes the following main steps: Product knowledge, Prospecting, Planning the sale (Pre-approach), Approach, Need assessment, Presentation, Meeting objections, Gaining commitment, Follow-up.
Create fast and easy your own Flowcharts of sales business processes using the ConceptDraw DIAGRAM ector graphic software extended with Cross-Functional Flowcharts solution from Business Processes area and also Sales Flowcharts solution from Marketing area of ConceptDraw Solution Park.
SWOT analysis Software & Template for Macintosh and Windows
Experienced businessmen and professional marketing specialists know that the success in business largely depends on the chosen company's development strategy. To develop a correct development and promotion strategy for each individual business enterprise is needed a SWOT analysis. It is used to prepare marketing strategies for growing your business in the right direction, helps to develop the strategic alternative in the field of staff management and logistics, assists to know the strengths and weaknesses of the company, and also to identify the factors that affect the industry as a whole and this company in particular. Professional SWOT analysis is often holding by consulting companies. SWOT analysis is that tool which lets you make your business more successful. Realize it easily using professional SWOT analysis software developed for Macintosh and Windows OS - ConceptDraw DIAGRAM. Enhanced with SWOT and TOWS Matrix Diagrams solution, ConceptDraw DIAGRAM offers a lot of predesigned vector stencils for SWOT analysis, quick-start templates, useful SWOT samples and TOWS examples.Marketing Charts
ConceptDraw DIAGRAM diagramming and vector drawing software offers the Marketing Diagrams Solution from the Marketing Area with extensive drawing tools, predesigned vector shapes, templates and samples for fast and easy drawing marketing charts and diagrams, marketing schemes and flow charts, various marketing illustrations, etc.Risk Analysis
Risk Analysis. ConceptDraw Office suite is a software for decision making. The Seven Management and Planning Tools is a tool for Risks Diagram drawing. This diagram identifies possible risks in accomplishing corrective actions. With the Risks Diagram, one analyzes each action separately in a tree of all actions and develops a preventive action in response of each potential obstacles or circumstances which may be a risk.Sales Process
ConceptDraw DIAGRAM is effective software for a variety of activity fields. Now, extended with Sales Flowcharts solution from the Marketing area of ConceptDraw Solution Park it become also useful in the field of sales. It helps to design professional looking Sales Flowcharts, Sales Process Flowcharts, Sales Process Maps, Plans and Diagrams to effectively realize the process of selling a product or service, and to display the sales results. Flowchart What is Flowchart
The Flowcharts have one or more starting and ending points. The geometric figures on the Flowcharts represent the steps of the process and are connected with arrows that show the sequence of the actions. The Flowcharts can be orientated vertically or horizontally.
ConceptDraw DIAGRAM is a powerful software for creating professional looking Flowcharts quick and easy. For this purpose you can use the Flowcharts solution from the Diagrams area of ConceptDraw Solution Park.
Orgchart
Workforce planning is strategically important for each company, organization, enterprise, and corporation, non important it is business, commercial, non-profit or government organization. Organizational Chart or Orgchart is a type of diagram that is successfully used to graphically illustrate the structure of an organization and also relationships between its parts. There are three different types of Orgcharts: hierarchical, matrix and flat. ConceptDraw DIAGRAM diagramming and vector drawing software supplied with Organizational Charts Solution from Management Area is the best for easy designing professional-looking Orgcharts. This solution provides you the predesigned samples and Organizational Chart library with ready-to-use vector objects required for Orgchart design. It also offers the most simple way of drawing - the possibility to start with one of built-in Orgchart templates. Typically Orgcharts require for regular updating and making modifications, in ConceptDraw DIAGRAM it is fast and easy, the blocks are editable and remain connected when they are moved.Marketing and Sales Organization chart. Organization chart Example
The use of Organization Charts is very popular at the fields of marketing and sales. They help to depict in a visual form a lot of information about organization: the company's structure, relationships of positions within an organization in terms of authorities and responsibilities, and company's strategies. All Organizational Charts are constructed from the similar building blocks (rectangles and lines), this makes them easily for interpretation and understanding by all interested people inside and outside of this company, such as shareholders, employees, investors, distributors, suppliers, customers, etc. Organization Charts can be hand-drawn on the paper, however the preferable is to use a special software. ConceptDraw DIAGRAM diagramming and vector graphics software extended with useful Organizational Charts solution is ideal for easy representing information and data, and professional drawing Marketing and Sales Organization Chart with any depth of detailing. Organizational structure may differ during the company's development, you can design and compare the charts on each stage.Sales Flowcharts
The Sales Flowcharts solution lets you create and display sales process maps, sales process workflows, sales steps, the sales process, and anything else involving sales process management.
SWOT Analysis Tool for Small Business
SWOT analysis is effective method of making the plan to evaluate the Strengths, Weaknesses, Opportunities, and Threats involved in a project. SWOT analysis includes the specifying project objectives and attentive identifying the internal and external causes for accomplishing the main project goals. It is actively used in large and small business project management for effective and clear identifying the critical factors. SWOT and TOWS Matrix Diagrams solution is included to ConceptDraw Solution Park and contains the high-quality analysis tools. This graphical solution turns the ConceptDraw DIAGRAM software in an excellent marketing management and advertising agency software, the best SWOT analysis tool for small business or large, as you like and need. Included graphic tools, visual and project planning components make it the best marketing project management software for marketing project planning and for making marketing presentations. Use the ConceptDraw DIAGRAM to create professional and well-designed SWOT matrices in minutes.Business Graphics Software
ConceptDraw DIAGRAM business graphics software provides wide opportunities for creativity and helps generate amazing visuals by using the included drawing tools. Creatively designed graphics can communicate ideas and information more efficiently. Grow and improve your business and boost your brand awareness through appealing graphic design. Distinct and memorable visuals grab the attention of your audience efficiently. Create well-designed, attractive, and stylish graphical content with the Business Process Workflow Diagrams solution. The colorful graphics are pleasing to the eyes, impact positive first impression, and make reading the content more interesting. Highlight important things with colors or differentiated fonts.- Fire and Emergency Plans | Managing your Sales Dashboard
- Flowchart Marketing Process. Flowchart Examples | Flowchart ...
- Sales Process Management | Lean Six Sigma Diagram Software
- Orders by months | Sales manager dashboard - Conceptdraw.com
- Property Management Examples | Land sales process flowchart ...
- KPI Dashboard | The Sales Process | Kpi For Sales Manager Pdf
- Dashboard | What is a KPI? | How to Create a Sales Dashboard ...
- Sales workflow - Vector stencils library | Design elements - Sales ...
- Sales Dashboard | Sales manager dashboard | Comparison ...