Basic Diagramming
Create flowcharts, organizational charts, bar charts, line graphs, and more with ConceptDraw PRO.
Create Graphs and Charts
Charting Software allows you to create diagrams, charts, graphs, flowcharts, and other business graphics. ConceptDraw PRO include simple shape drawing tools, examples, templates, and symbol libraries.Bar Diagrams for Problem Solving. Create manufacturing and economics bar charts with Bar Graphs Solution
Create bar charts for visualizing problem solving in manufacturing and economics using the ConceptDraw PRO diagramming and vector drawing software extended with the Bar Graphs Solution from the Graphs and Charts area of ConceptDraw Solition Park.Online Collaboration via Skype
Collaborating with co-workers is very important, not only in order to get things done effectively, but also to keep in touch with the outside world. Great way for business collaboration is Skype.
Bar Diagrams for Problem Solving. Create business management bar charts with Bar Graphs Solution
Create bar charts for business management problem solving and data comparison using the ConceptDraw PRO diagramming and vector drawing software extended with the Bar Graphs Solution from the Graphs and Charts area of ConceptDraw Solition Park.Polar Graph
This sample shows the Polar Graph. The Polar Graph is a graph in the polar coordinate system in which the each point on the plane is defined by two values - the polar angle and the polar radius. The certain equations have very complex graphs in the Cartesian coordinates, but the application of the polar coordinate system allows usually produce the simple Polar Graphs for these equations.Bar Chart Examples
Complete set of bar chart examples is produced using ConceptDraw software. Surfing bar chart examples you can find an example that is the best for your case.Bar Chart Template for Word
All these bar chart templates are included in the Bar Graphs solution.You can quickly rework these bar graph templates into your own charts by simply changing displayed data, title and legend texts.
Reporting & Data Visualization
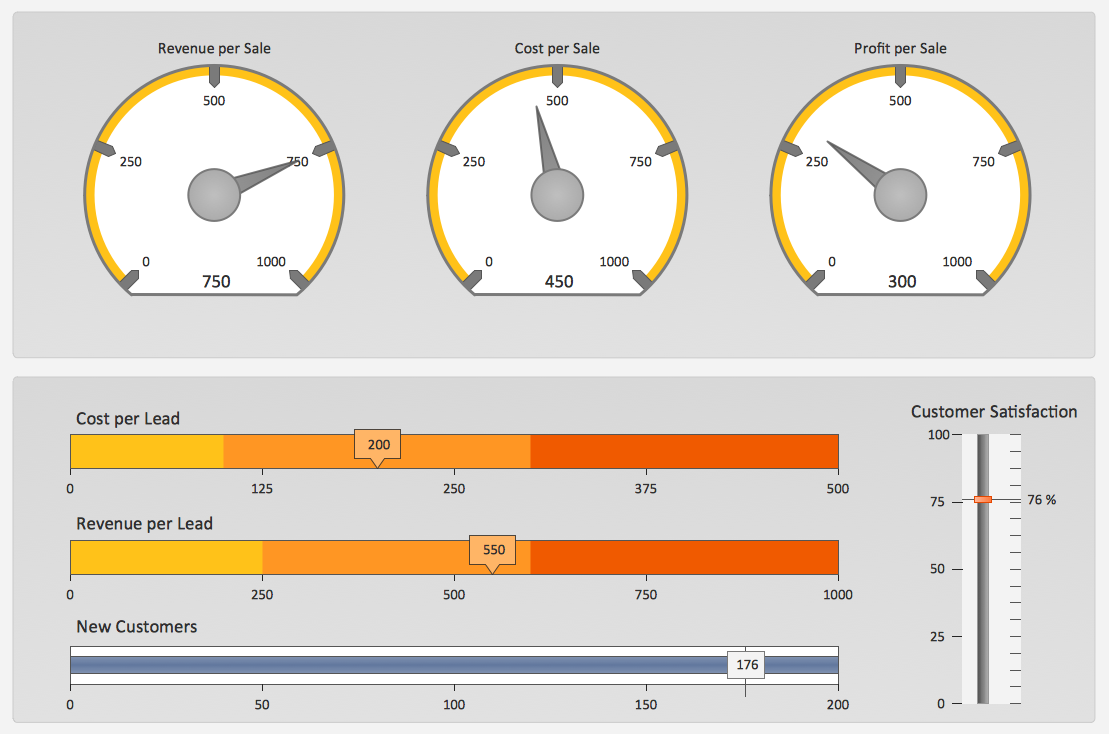
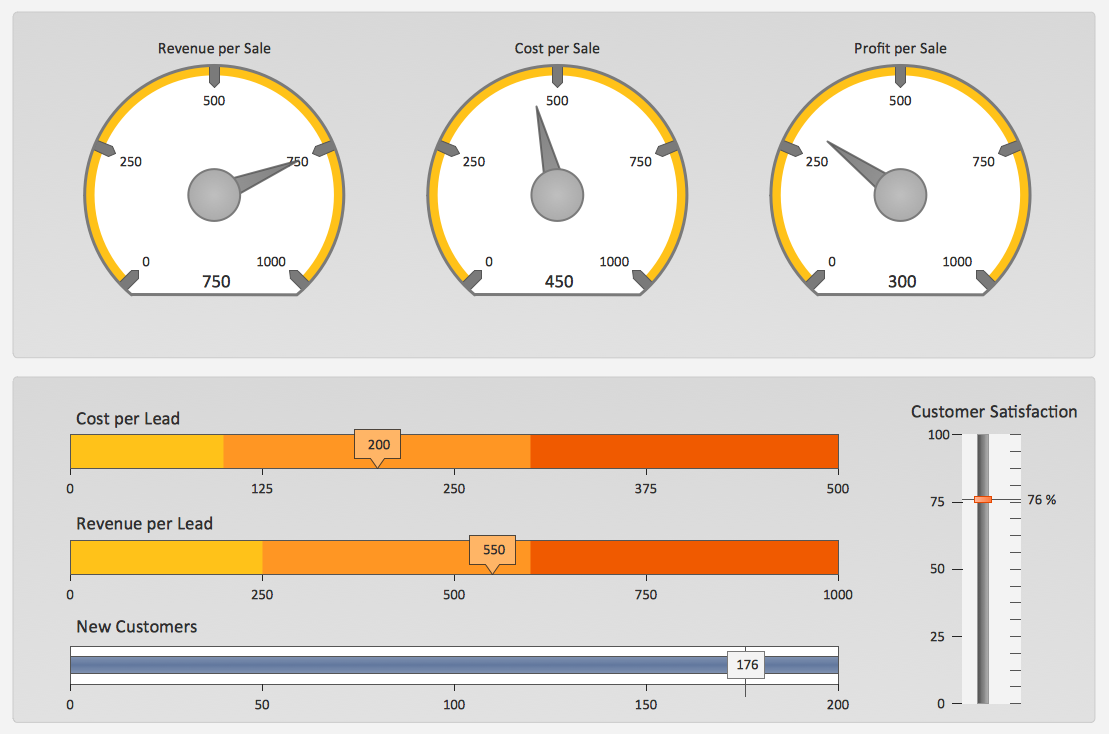
Using professional reporting and data visualization is the way your business can improve. ConceptDraw Sales Dashboard solution allows you produce live dashboards show KPI to monitor you sales activity and results in real time.Sales Dashboard - insight about potential opportunities and key sales operations
ConceptDraw Sales Dashboard gives you a clear insight about potential opportunities and key sales operations. Analysing sales KPI is a proven way to see how your business can improve.Sales Dashboard Solutions can help your sales team keep an eye on performance
ConceptDraw Sales Dashboard Solution is a simple and effective way of visualizing sales data and get clear picture of your sales process to see how your business can improve.Sales KPI Dashboards
A combination of sales KPI on a one dashboard helps you track sales activities and results. Visualizing sales data using ConceptDraw PRO software extended with the Sales Dashboard solutiongives you flexibility in choosing and tuning KPIs.
 Sales Dashboard
Sales Dashboard solution extends ConceptDraw PRO software with templates, samples and library of vector stencils for drawing the visual dashboards of sale metrics and key performance indicators (KPI).
Sales Teams are Inherently Competitive
Sales teams are inherently competitive, so you don't need to invent extra ways to stimulate the competition. At the same time, you can provide the team with a sales dashboard shows company, team and personal KPI to make the competition clear.The Facts and KPIs
Visualizing sales data help you see the facts and KPIs about your sales process to make conclusions and see how your business can improve.- Sales Growth. Bar Graphs Example | Bar Chart Examples | Financial ...
- Chart Maker for Presentations | Sales Growth. Bar Graphs Example ...
- Sample Sales Report Using Bar Graph
- Sales Growth. Bar Graphs Example | Bar Chart Template for Word ...
- Sales Growth. Bar Graphs Example | How to Create a Picture Graph ...
- Sales Growth. Bar Graphs Example | Bar Diagrams for Problem ...
- Bar Graphs | Sales Growth. Bar Graphs Example | Bar Graph | Bar ...
- Sales Report Graph Sample
- Sales Growth. Bar Graphs Example | Sales Flowcharts ...
- Sales Growth. Bar Graphs Example | Sales KPIs and Metrics - Vector ...
- Sales Growth. Bar Graphs Example | Bar Chart Template for Word ...
- Business Report With Graphs
- Picture Graphs | Sales Growth. Bar Graphs Example | Barrie ...
- A Flowchart For Sale Report Sample
- Create Graphs and Charts | Sales Growth. Bar Graphs Example ...
- Sales Growth. Bar Graphs Example | Bar Chart Template for Word ...
- Sales Growth. Bar Graphs Example | Event-driven Process Chain ...
- Online Collaboration via Skype | Sales Growth. Bar Graphs Example ...
- Sample Sales Data And Graphs Report
- Sales Growth. Bar Graphs Example | AWS Architecture Diagrams ...


