"A performance indicator or key performance indicator (KPI) is a type of performance measurement. An organization may use KPIs to evaluate its success, or to evaluate the success of a particular activity in which it is engaged. Sometimes success is defined in terms of making progress toward strategic goals, but often success is simply the repeated, periodic achievement of some level of operational goal (e.g. zero defects, 10/ 10 customer satisfaction, etc.). Accordingly, choosing the right KPIs relies upon a good understanding of what is important to the organization. 'What is important' often depends on the department measuring the performance - e.g. the KPIs useful to finance will be quite different from the KPIs assigned to sales. Since there is a need to understand well what is important (to an organization), various techniques to assess the present state of the business, and its key activities, are associated with the selection of performance indicators. These assessments often lead to the identification of potential improvements, so performance indicators are routinely associated with 'performance improvement' initiatives." [Performance indicator. Wikipedia]
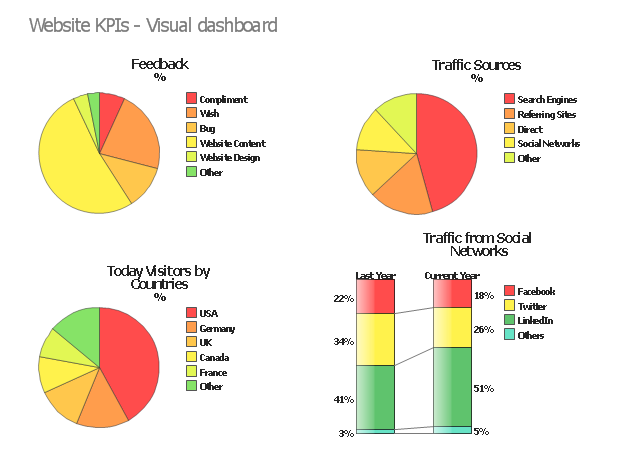
The example "Website KPIs - Visual dashboard" was created using the ConceptDraw PRO diagramming and vector drawing software extended with the Composition Dashboard solution from the area "What is a Dashboard" of ConceptDraw Solution Park.
The example "Website KPIs - Visual dashboard" was created using the ConceptDraw PRO diagramming and vector drawing software extended with the Composition Dashboard solution from the area "What is a Dashboard" of ConceptDraw Solution Park.
 Area Charts
Area Charts are used to display the cumulative totals over time using numbers or percentages; or to show trends over time among related attributes. The Area Chart is effective when comparing two or more quantities. Each series of data is typically represented with a different color, the use of color transparency in an object’s transparency shows overlapped areas and smaller areas hidden behind larger areas.
- Performance Indicators | Constant improvement of key performance ...
- Performance Indicators | Design elements - Sales KPIs and metrics ...
- Sales KPI Dashboards
- A KPI Dashboard | A KPI Dashboard Provides the Answers Your ...
- Sales KPI Dashboards | A KPI Dashboard Provides the Answers ...
- The Facts and KPIs | KPIs and Metrics | Website KPIs - Visual ...
- A KPI Dashboard | A KPI Dashboard Provides the Answers Your ...
- Website KPIs - Visual dashboard | A KPI Dashboard Provides the ...
- Sales Dashboard Template | Sales KPI Dashboards | Customer ...
- Sales metrics and KPIs - Visual dashboard | Website KPIs - Visual ...
- Enterprise dashboard | Meter Dashboard | Website KPIs - Visual ...
- Website KPIs - Visual dashboard | A KPI Dashboard Provides the ...
- KPI Dashboard
- ConceptDraw PRO DFD Software | Software for Creating SWOT ...
- Design elements - Meter indicators
- Data Visualization Solutions | How to Connect Tabular Data (CSV ...
- Mapping Software For Sales
- Website metrics - Visual dashboard | Website traffic dashboard ...
- Feature Comparison Chart Software | How to Import Project Data ...
- Design elements - Meter indicators 2 | PM Dashboards | How To ...
