 Marketing
This solution extends ConceptDraw PRO v9 and ConceptDraw MINDMAP v7 with Marketing Diagrams and Mind Maps (brainstorming, preparing and holding meetings and presentations, sales calls).
 USA Maps
Use the USA Maps solution to create a map of USA, a US interstate map, printable US maps, US maps with cities and US maps with capitals. Create a complete USA states map.
 Sales Dashboard
Sales Dashboard solution extends ConceptDraw PRO software with templates, samples and library of vector stencils for drawing the visual dashboards of sale metrics and key performance indicators (KPI).
HelpDesk
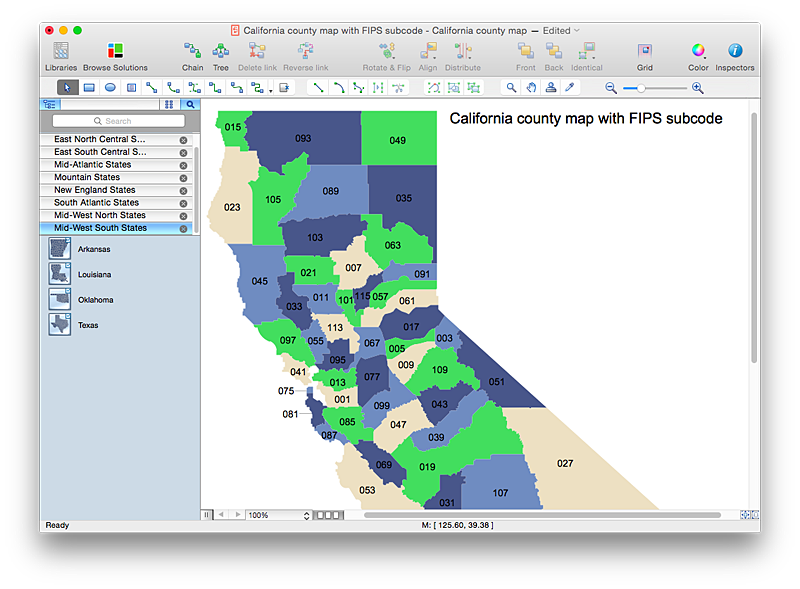
How to Draw a Map of USA States Using ConceptDraw PRO
You can found a huge set of geopolitical statistical data regarding America. A common way of visualizing this data is to create maps that connect a particular data in relation to a specific geographical area. Thematic maps are used to depict such data as population density, average rainfall, or political allegiance, representing the data by using visual elements and annotation. Thematic maps always focus on one particular subject matter unlike general reference maps, which display information on a different subjects — vegetation, topology, roads and highways, etc. The United States Mapping Solution for ConceptDraw PRO includes all of the US States with county outlined borders, from the largest, San Bernardino in California, to the smallest Kalawao County, Hawaii.- Project task status dashboard - Template | Sales Dashboard ...
- Project task status dashboard - Template | Sales Dashboard ...
- Organization Chart Templates | Marketing and Sales Organization ...
- Sales Dashboard Template | How to Create the Custom Diagram ...
- Product life cycle graph - Template
- Sales Dashboard Template | Dashboard | Meter Dashboard ...
- Bar Chart Template for Word | Sales Growth. Bar Graphs Example ...
- How to Draw an Organization Chart | Organizational Chart ...
- Sales Dashboard Template
- An Example Of A Drawn Skeleton Chart Of Sales Department In ...
- KPI Dashboard | Sales Dashboard | Dashboard | Free Dashboard ...
- Chart Maker for Presentations | Chart Software for Better ...
- Sales Dashboard Template | KPI Dashboard | A KPI Dashboard ...
- Learn how to create a current state value stream map | Lean ...
- Sales Dashboard Template
- Sales Dashboard | Entity-Relationship Diagram (ERD) | Cross ...
- Sales Dashboard Template | Europe spatial dashboard template ...
- Dashboard Website Template
- Boston growth-share matrix - Template | BCG Matrix | Growth-Share ...
- Sales Growth. Bar Graphs Example | Double bar graph - Template ...
