The vector stencils library "Sales KPIs and Metrics" contains 15 chart templates and graphic indicators of sales key performance indicators (KPIs) and metrics for drawing sales dashboards: line charts "Cost per order" and "Clicks from Sales Follow-Up Emails", column charts "Social Media Usage" and "Usage Rate of Marketing Collateral", horizontal bar charts "Rate of Follow Up Contact", "Cost per customer" and "Lead Response Time", pie charts "Product mix", "Product Performance" and "Rate of Contact", gauge (speedometer) indicators "Sales Growth" and "Actual vs Plan", bullet indicator "Sales Target", diamond alarm indicators "Average Purchase Value", "Quote to Close Ratio", "Opportunity-to-Win Ratio" and "Sales Ratio".
The dashboard charts and indicators example "Design elements - Sales KPIs and metrics" for the ConceptDraw PRO diagramming and vector drawing software is included in the Sales Dashboard solution from the Marketing area of ConceptDraw Solution Park.
www.conceptdraw.com/ solution-park/ marketing-sales-dashboard
The vector stencils library "Sales dashboard" contains 27 charts and indicators: bar charts, line graphs, gauges, sliders, pie charts, divided bar diagrams, bubble indicators, bullet indicators.
The design elements library "Sales dashboard" for the ConceptDraw PRO diagramming and vector drawing software is included in the Sales Dashboard solution from the Marketing area of ConceptDraw Solution Park.
The design elements library "Sales dashboard" for the ConceptDraw PRO diagramming and vector drawing software is included in the Sales Dashboard solution from the Marketing area of ConceptDraw Solution Park.
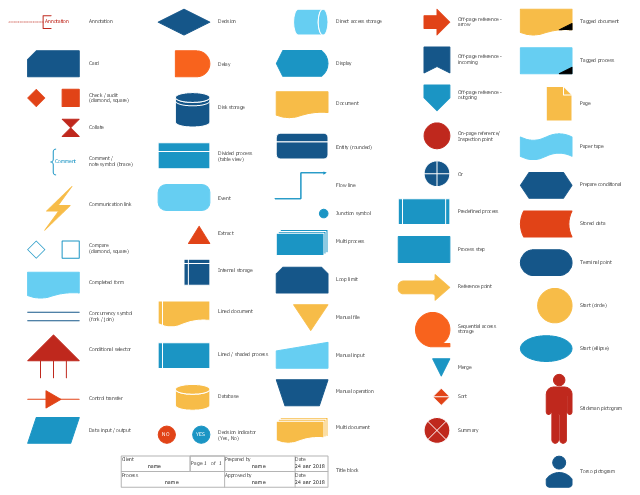
The vector stencils library "Sales flowchart" contains 62 flow chart symbols.
Use it to design your sales flowcharts, workflow diagrams and process charts by the ConceptDraw PRO diagramming and vector drawing software.
"Flowcharts are used in designing and documenting simple processes or programs. Like other types of diagrams, they help visualize what is going on and thereby help understand a process, and perhaps also find flaws, bottlenecks, and other less-obvious features within it. There are many different types of flowcharts, and each type has its own repertoire of boxes and notational conventions. The two most common types of boxes in a flowchart are:
(1) a processing step, usually called activity, and denoted as a rectangular box,
(2) a decision, usually denoted as a diamond." [Flowchart. Wikipedia]
The shapes example "Design elements - Sales flowchart" is included in the Sales Flowcharts solution from the Marketing area of ConceptDraw Solution Park.
 Sales Dashboard
Sales Dashboard solution extends ConceptDraw PRO software with templates, samples and library of vector stencils for drawing the visual dashboards of sale metrics and key performance indicators (KPI).
- Performance Indicators | PM Dashboards | Design elements - Sales ...
- Design elements - Sales KPIs and metrics | Bar Diagrams for ...
- Design elements - Sales KPIs and metrics | Performance Indicators ...
- Sales KPIs and Metrics - Vector stencils library | Design elements ...
- Design elements - Sales dashboard | Sales Dashboard - Access ...
- Flowchart Example: Flow Chart of Marketing Analysis | Sales ...
- Sales Growth. Bar Graphs Example | Bar Chart Examples | Business ...
- Meter Dashboard | Design elements - Sales dashboard | Sales ...
- Activity Network (PERT) Chart | Types of Flowchart - Overview ...
- Marketing Charts | Design elements - Marketing charts | Market ...
- Flowchart Marketing Process. Flowchart Examples | Flowchart ...
- Process Flowchart | Create Process Flowcharts | Sales Process ...
- Basic Flowchart Symbols and Meaning | Design elements - Sales ...
- Design elements - Sales KPIs and metrics | Sales Teams are ...
- Design elements - Sales KPIs and metrics | Geo Map - Asia | BCG ...
- Flat design floor plan | Flow chart Example. Warehouse Flowchart ...
- Sales Process Flowchart Symbols | Sales Flowcharts | Design ...
- Sales Process Flowchart Symbols | Flowchart design . Flowchart ...
- Sales Process Flow Chart
- Designs For Target Chart


