 Sales Flowcharts
The Sales Flowcharts solution lets you create and display sales process maps, sales process workflows, sales steps, the sales process, and anything else involving sales process management.
 Event-driven Process Chain Diagrams
Event-driven Process Chain (EPC) Diagram is a type of flowchart widely used for modeling in business engineering and reengineering, business process improvement, and analysis. EPC method was developed within the Architecture of Integrated Information Systems (ARIS) framework.
 ConceptDraw Solution Park
ConceptDraw Solution Park collects graphic extensions, examples and learning materials
HelpDesk
Event-driven Process Chain (EPC) Diagram Software
An EPC diagram is a type of flowchart used in business process analysis. It shows different business processes through various work flows. The workflows are shown as processes and events that are related to different executes and tasks that allow business workflow to be completed. An EPC diagram shows different business processes through various workflows. The workflows are seen as functions and events that are connected by different teams or people, as well as tasks that allow business processes to be executed. The best thing about this type of enterprise modelling is that creating an EPC diagram is quick and simple as long as you have the proper tool. One of the main usages of the EPC diagrams is in the modelling, analyzing and re-engineering of business processes. With the use of the flowchart, businesses are able to see inefficiencies in the processes and modify to make them more productive. Event-driven process chain diagrams are also used to configure an enterprise resource plaHelpDesk
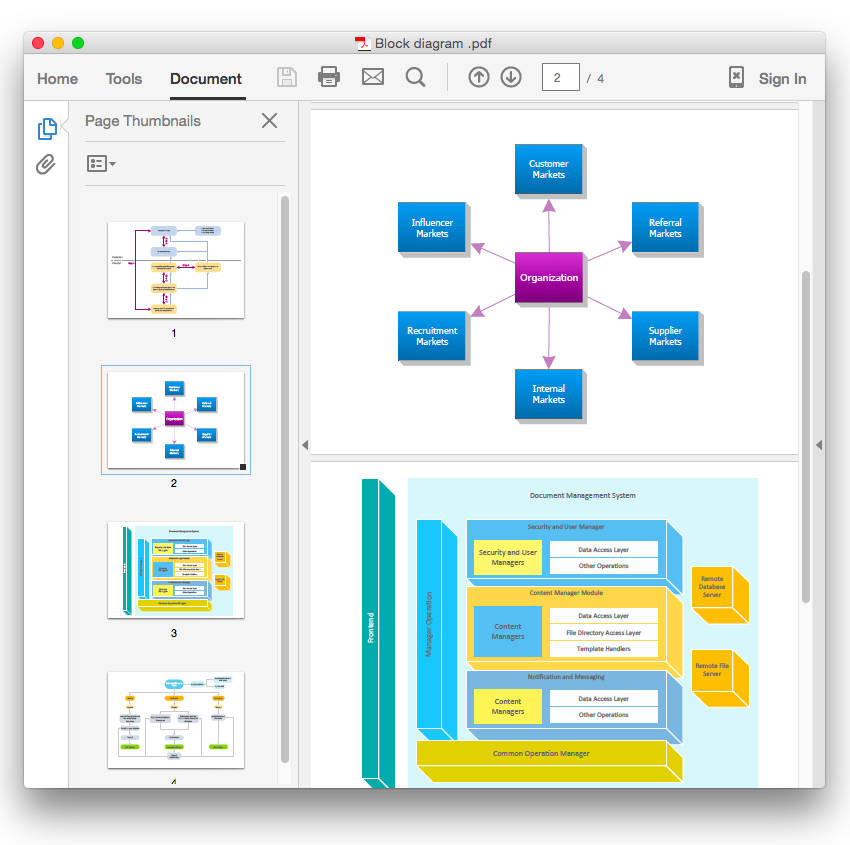
How To Convert a Block Diagram to Adobe PDF Using ConceptDraw PRO
ConceptDraw PRO allows you to easy share your business documentation between different computers with different operating systems and applications using it's export capabilities.You can get clear business graphic pack in pdf format and avoid any problems while communicating it with stakeholders.HelpDesk
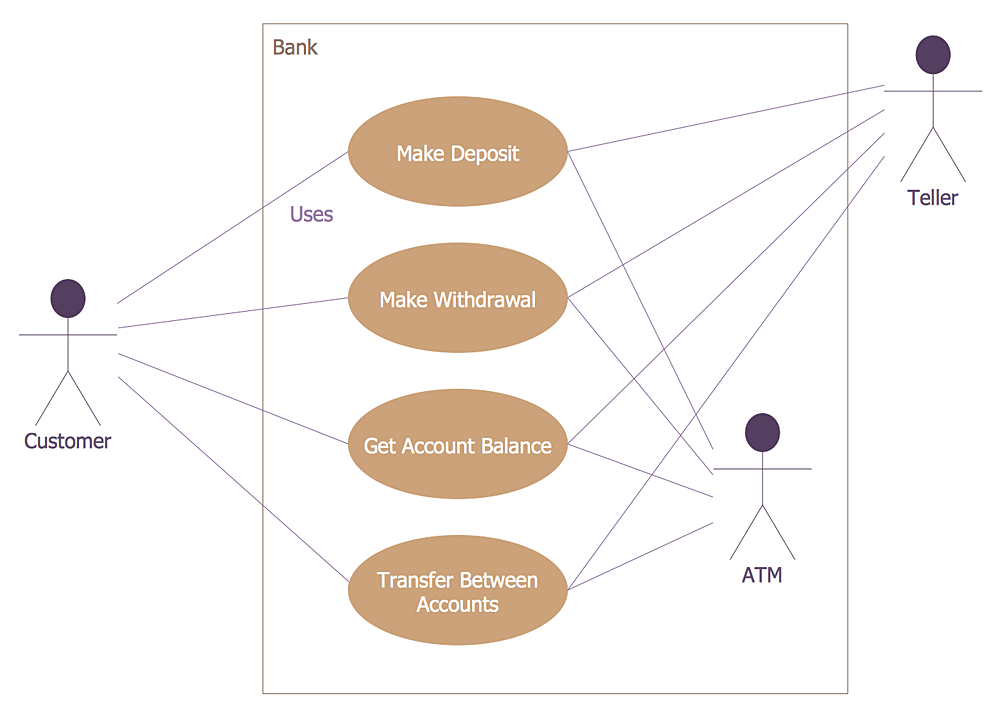
How to Create a Bank ATM Use Case Diagram
UML diagrams are often used in banking management for documenting a banking system. In particular, the interaction of bank customers with an automated teller machine (ATM) can be represented in a Use Case diagram. Before the software code for an ATM, or any other system design, is written, it is necessary to create a visual representation of any object-oriented processes. This is done most effectively by creating a Unified Modeling Language (UML) diagram, using object-oriented modeling. UML works as a general purpose modeling language for software engineers or system analysts, offering a number of different diagram styles with which to visually depict all aspects of a software system. ConceptDraw PRO diagramming software, enhanced and expanded with the ATM UML Diagrams solution, offers the full range of icons, templates and design elements needed to faithfully represent ATM and banking information system architecture using UML standards. The ATM UML Diagrams solution is useful for beginner and advanced users alike. More experienced users will appreciate a full range of vector stencil libraries and ConceptDraw PRO's powerful software, that allows you to create your ATM UML diagram in a matter of moments.- Sales Process Flowchart. Flowchart Examples | Business Process ...
- Process Flowchart | Sales Process Flowchart. Flowchart Examples ...
- Car Sales Process Diagram
- Block diagram - Selling technology patent process | Relations ...
- Sales Process Flowchart. Flowchart Examples | Block diagram ...
- Sales Process Flowchart. Flowchart Examples | Marketing | Swot ...
- Flowchart Marketing Process. Flowchart Examples | Sales Process ...
- Sales Process Flowchart. Flowchart Examples | Sales Process Steps ...
- Process Flowchart | Sales Process Flowchart. Flowchart Examples ...
- Sales Process Flowchart. Flowchart Examples | Business Process ...
- Relations diagram - Sales process | Business Process Diagram ...
- Sales Process Diagram
- Credit Card Processing System UML Diagram | Process Flowchart ...
- Sales Process Flowchart. Flowchart Examples | Sales Flowcharts ...
- Sales Process Flowchart. Flowchart Examples | Global liquidity ...
- DFD - Process of account receivable | Data Flow Diagram Process ...
- Basic Flowchart Symbols and Meaning | Account Flowchart ...
- Entity-Relationship Diagram (ERD) | Marketing | Sales Dashboard ...
- Process Flowchart | Flowchart of Products. Flowchart Examples ...
- Ishikawa Diagram Sales


