Sales Growth. Bar Graphs Example

Percentage Pie Chart. Pie Chart Examples

The vector stencils library "Sales KPIs and Metrics" contains 15 chart templates and graphic indicators of sales key performance indicators (KPIs) and metrics.
Use it for drawing sales dashboards in the ConceptDraw PRO diagramming and vector drawing software extended with the Sales Dashboard solution from the Marketing area of ConceptDraw Solution Park.
Use it for drawing sales dashboards in the ConceptDraw PRO diagramming and vector drawing software extended with the Sales Dashboard solution from the Marketing area of ConceptDraw Solution Park.
Actual vs Plan

Average Purchase Value

Clicks from Sales Follow-Up Emails

Cost per customer

Cost per order

Lead Response Time

Opportunity-to-Win Ratio

Product mix

Product Performance

Rate of Contact

Rate of Follow Up Contact

Sales Growth

Sales Target

Social Media Usage

Usage Rate of Marketing Collateral

Pictures of Graphs

The vector stencils library "Sales KPIs and Metrics" contains 15 chart templates and graphic indicators of sales key performance indicators (KPIs) and metrics.
Use it for drawing sales dashboards in the ConceptDraw PRO diagramming and vector drawing software extended with the Sales Dashboard solution from the Marketing area of ConceptDraw Solution Park.
Use it for drawing sales dashboards in the ConceptDraw PRO diagramming and vector drawing software extended with the Sales Dashboard solution from the Marketing area of ConceptDraw Solution Park.
Actual vs Plan
Average Purchase Value
Clicks from Sales Follow-Up Emails
Cost per customer
Cost per order
Lead Response Time
Opportunity-to-Win Ratio
Product mix
Product Performance
Rate of Contact
Rate of Follow Up Contact
Sales Growth
Sales Target
Social Media Usage
Usage Rate of Marketing Collateral
Sales Dashboards for Your Company
The vector stencils library "Sales KPIs and Metrics" contains 15 chart templates and graphic indicators of sales key performance indicators (KPIs) and metrics.
Use it for drawing sales dashboards in the ConceptDraw PRO diagramming and vector drawing software extended with the Sales Dashboard solution from the Marketing area of ConceptDraw Solution Park.
Use it for drawing sales dashboards in the ConceptDraw PRO diagramming and vector drawing software extended with the Sales Dashboard solution from the Marketing area of ConceptDraw Solution Park.
Actual vs Plan
Average Purchase Value
Clicks from Sales Follow-Up Emails
Cost per customer
Cost per order
Lead Response Time
Opportunity-to-Win Ratio
Product mix
Product Performance
Rate of Contact
Rate of Follow Up Contact
Sales Growth
Sales Target
Social Media Usage
Usage Rate of Marketing Collateral
How To Create Floor Plans


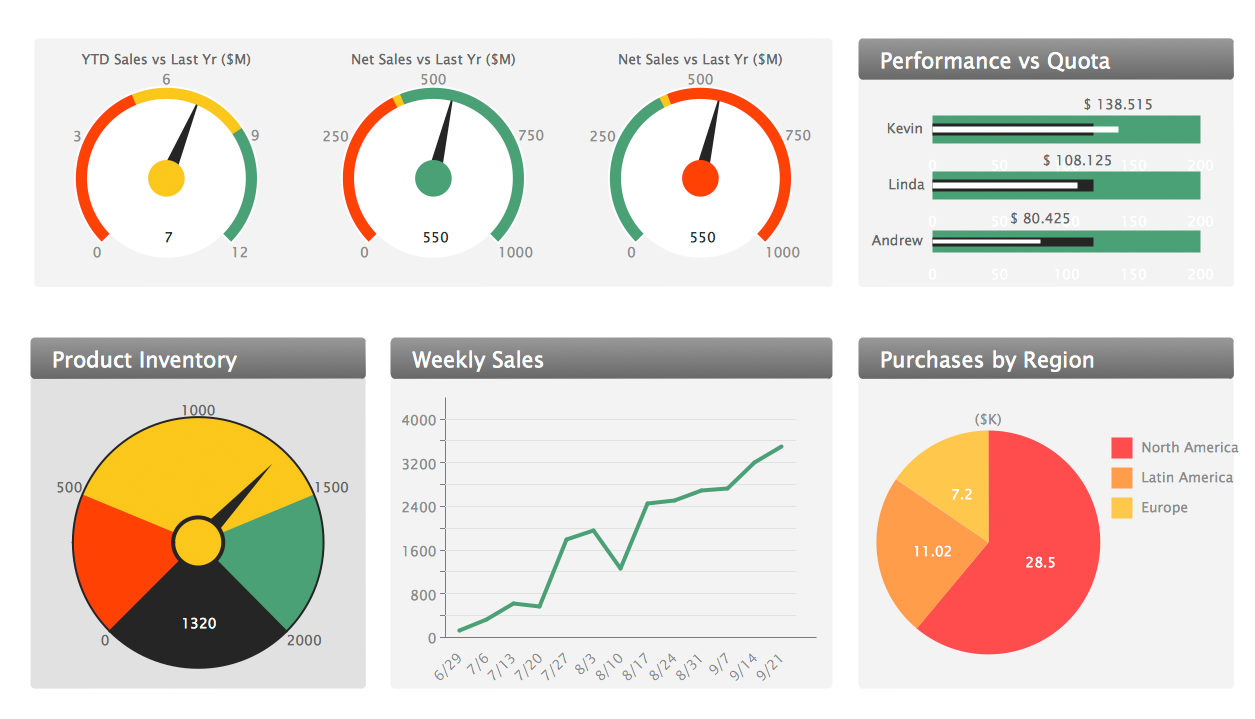
Sales Dashboard
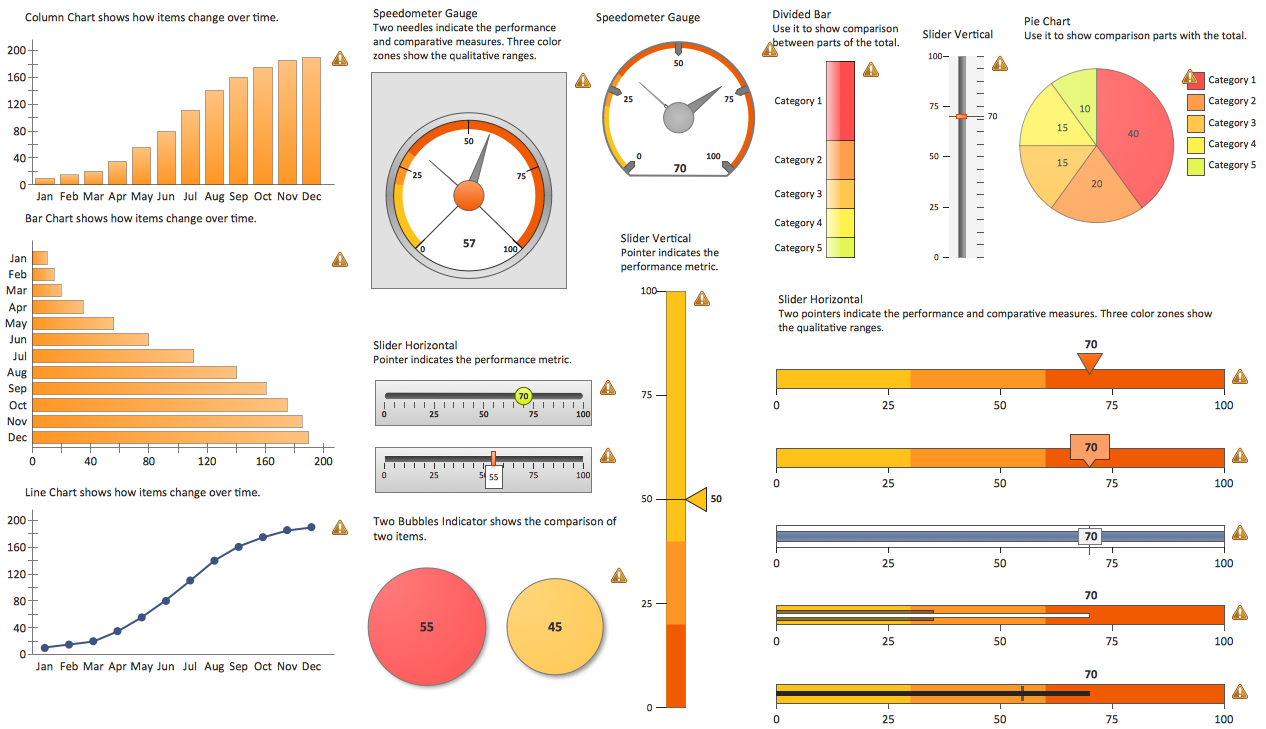
The vector stencils library "Sales KPIs and Metrics" contains 15 chart templates and graphic indicators of sales key performance indicators (KPIs) and metrics for drawing sales dashboards: line charts "Cost per order" and "Clicks from Sales Follow-Up Emails", column charts "Social Media Usage" and "Usage Rate of Marketing Collateral", horizontal bar charts "Rate of Follow Up Contact", "Cost per customer" and "Lead Response Time", pie charts "Product mix", "Product Performance" and "Rate of Contact", gauge (speedometer) indicators "Sales Growth" and "Actual vs Plan", bullet indicator "Sales Target", diamond alarm indicators "Average Purchase Value", "Quote to Close Ratio", "Opportunity-to-Win Ratio" and "Sales Ratio".
The dashboard charts and indicators example "Design elements - Sales KPIs and metrics" for the ConceptDraw PRO diagramming and vector drawing software is included in the Sales Dashboard solution from the Marketing area of ConceptDraw Solution Park.
www.conceptdraw.com/ solution-park/ marketing-sales-dashboard
Sales dashboard charts and graphic indicators

- Seven Management and Planning Tools | Sample Sales Plan For ...
- Sales Business Plan Example
- How To use House Electrical Plan Software | Bus Network Topology ...
- Sales Plan | Data Visualization Solutions | How to Deliver ...
- Sales Growth . Bar Graphs Example | Column Chart Examples ...
- Sales Process Flowchart Symbols
- Sales Growth . Bar Graphs Example | Column Chart Template | How ...
- Sales Growth . Bar Graphs Example | Sales Dashboards for Your ...
- Example Of A Sales Plan
- Bar Graphs | Business Bar Graph