HelpDesk
How to Use ConceptDraw Sales Dashboard Solution
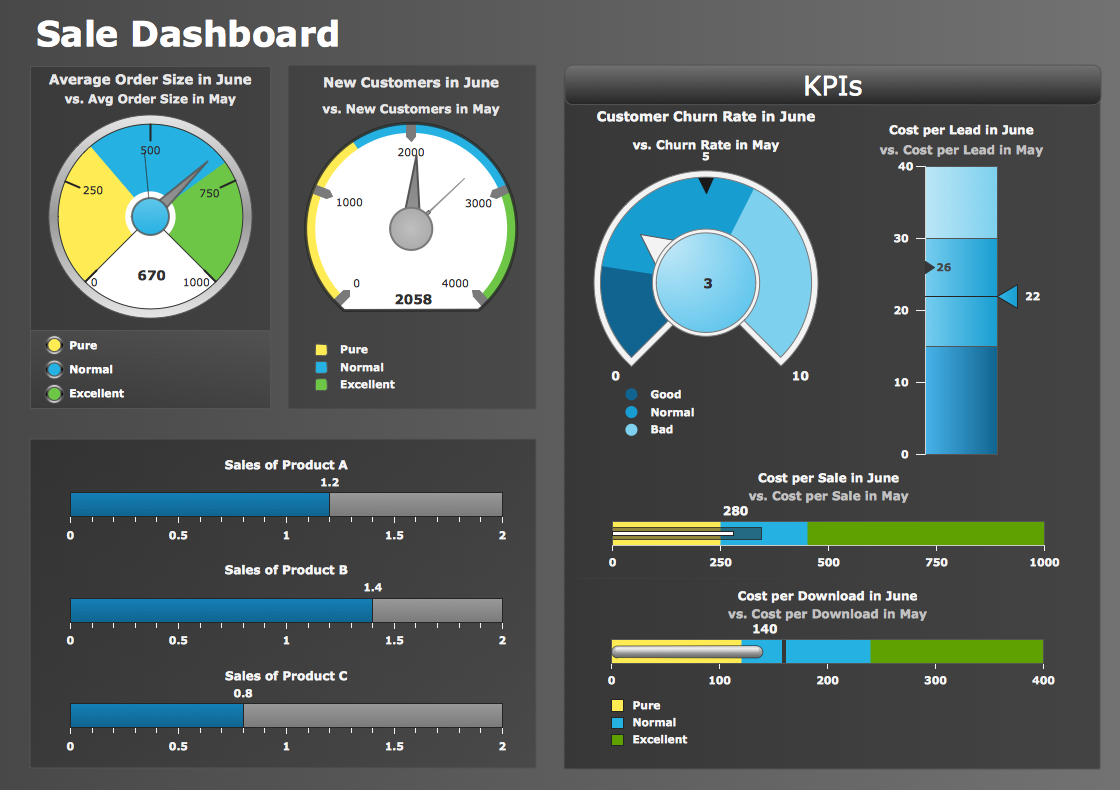
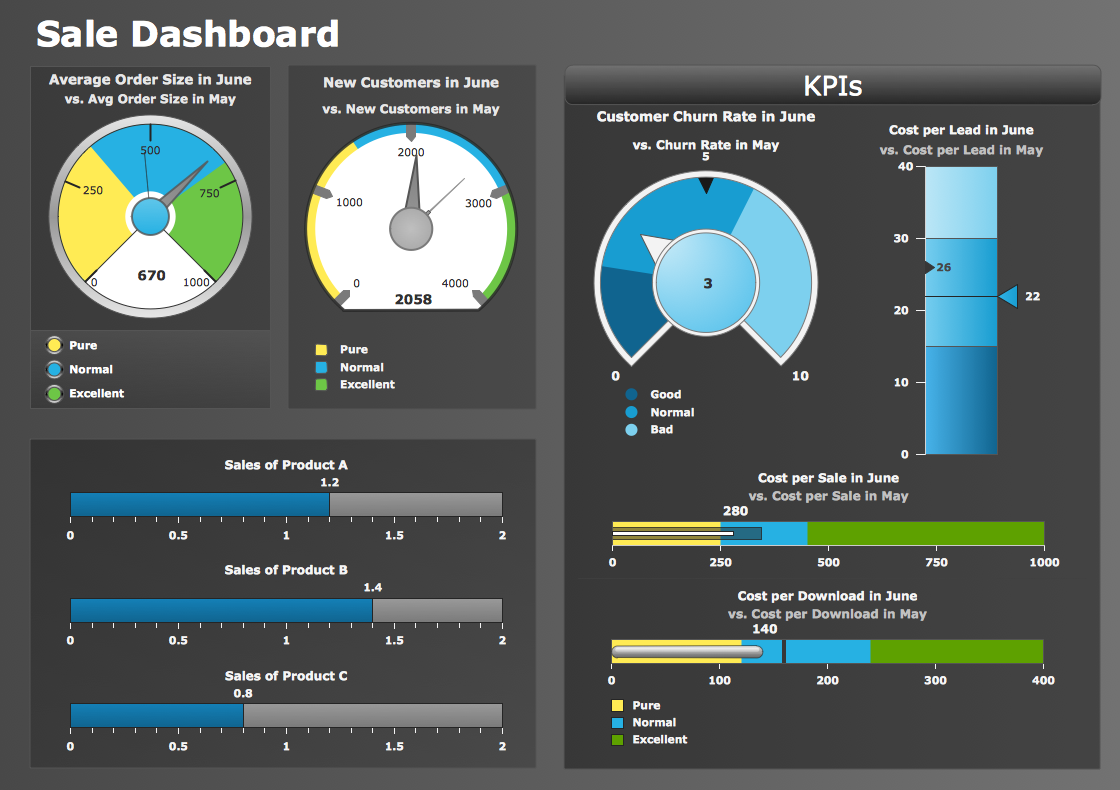
An interactive visual dashboard is a valuable tool for any sales team. Sales dashboard allows you to view and monitor sales indicators that are important for manager and sales staff. It helps to use timely and reliable information to improve the quality of sales performance and increase sales revenues. ConceptDraw Sales Dashboard solution is a tool for both: sales manager and sales team. It provides the visualization of key performance indicators that are critical to the entire sales organization. The custom sales dashboard displays real-time information on sales performance KPIs with the help of intuitive and easy-to-understand diagrams and charts. Sales Dashboard helps the entire team see where they are, and what needs to be done. With ConceptDraw DIAGRAM you can easily create a visual Sales Dashboard using Live Objects Technology.
 Sales Dashboard
Sales Dashboard solution extends ConceptDraw DIAGRAM software with templates, samples and library of vector stencils for drawing the visual dashboards of sale metrics and key performance indicators (KPI).
 Meter Dashboard
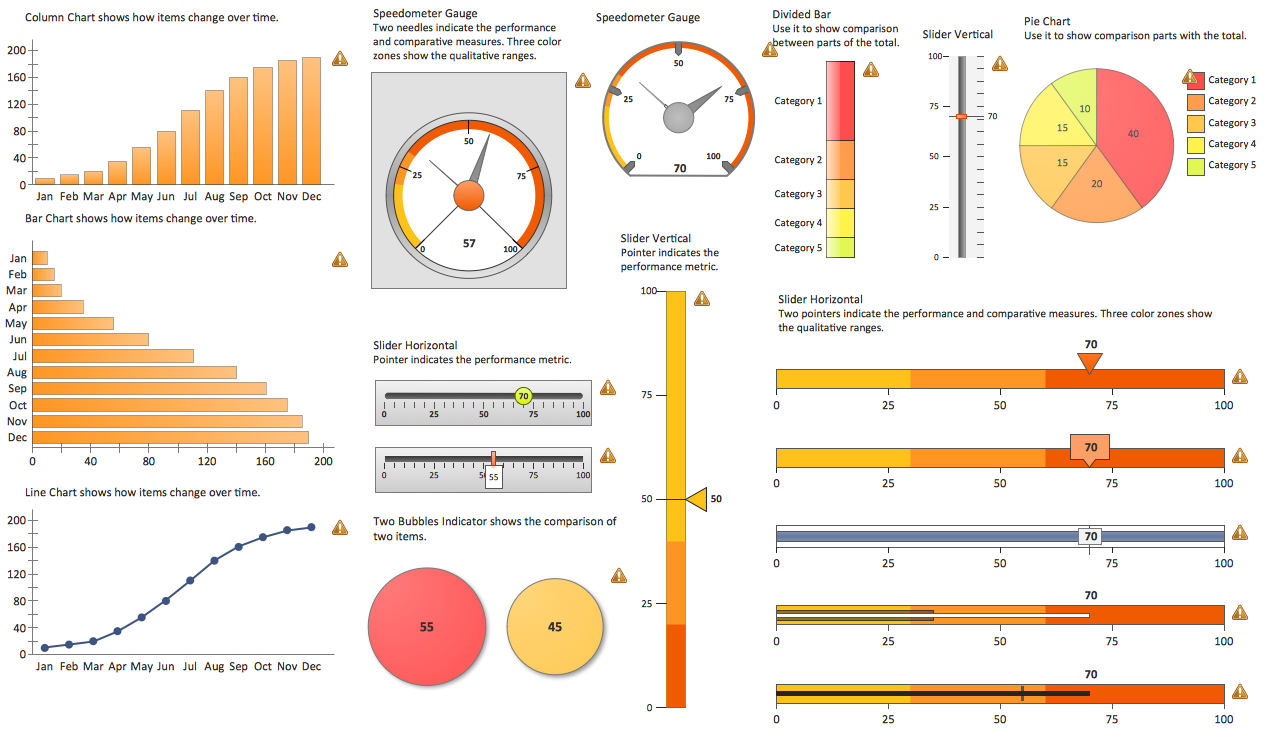
Meter dashboard solution extends ConceptDraw DIAGRAM software with templates, samples and vector stencils library with meter indicators for drawing visual dashboards showing quantitative data. The Meter Dashboard solution may be useful for many business owners, businessmen and other people who are involved in measuring their success by using the progressive tools.
 HR Dashboard
The HR Dashboard solution extends ConceptDraw DIAGRAM functionality with powerful drawing tools and great collection of comprehensive vector design elements, icons, pictograms and objects, navigation elements, live objects of HR charts, HR indicators, and thematic maps. The range of HR Dashboards applications is extensive, among them the human resource management, recruitment, hiring process, human resource development. ConceptDraw DIAGRAM software is perfect for creation HR Dashboard with any goal you need. It gives you all opportunities for designing not only informative, but also professional looking and attractive HR Dashboards of any style and degree of detalization, that are perfect for using in presentations, reports and other thematic documents.
 CRM Center Dashboard
The CRM Center Dashboard solution extends ConceptDraw DIAGRAM functionality with CRM software tools, large collection of CRM Charts live objects, CRM icons, CRM indicators, CRM maps and navigation elements, the set of professionally designed CRM samples and templates to help you construct your own CRM Dashboards and CRM Center Dashboards in a few minutes, to depict the current and actual data by connecting or refreshing the data source file. The customer management software ConceptDraw DIAGRAM makes you free to choose the style for your dashboard and to regulate the quantity of clipart on the diagram according to your taste.
 Logistic Dashboard
The powerful tools of Logistic Dashboard solution and specially developed live graphic objects of logistic icons, logistic navigation elements, logistic indicators, logistic charts and logistic maps effectively assist in designing Logistic dashboards, Logistic maps, Logistic charts, diagrams and infographics. The included set of prebuilt samples and quick-start templates, demonstrates the power of ConceptDraw DIAGRAM software in logistics management, its assisting abilities in development, realization and analyzing the logistic processes, and in perfection the methods of logistics management.
 Business Intelligence Dashboard
Business Intelligence Dashboard solution extends the ConceptDraw DIAGRAM functionality with exclusive tools, numerous ready-to-use vector objects, samples and quick-start templates for creation professional Business Intelligence Dashboards, Business Intelligence Graphics, Business Intelligence Charts and Maps of different kinds. Design easy the BI dashboard, BI model or Dynamic chart in ConceptDraw DIAGRAM to monitor the company's work, to track the indicators corresponding your company's data, to display and analyze key performance indicators, to evaluate the trends and regularities of the processes occurring at the company.
Performance Indicators
ConceptDraw DIAGRAM diagramming and vector drawing software offers the useful tools of the Sales Dashboard solution from the Marketing area for easy creating professional looking live dashboards which allow to track the business sales activity and progress thanks to representing the Key Performance Indicators (KPIs) on them.Business Intelligence Dashboard Software
ConceptDraw DIAGRAM is a business intelligence dashboard software that allows you produce sales dashboard that suites your specific needs. To see how your business can improve with sales dashboards select KPI and start tracking it.Sales Dashboards for Your Company
ConceptDraw DIAGRAM software extended with the Sales Dashboard solution allows you produce sales dashboards for your company easily. You can start from samples and templates delivered with the solution and then modify them to get a dashboard that suites your specific needs.
 Custom Excel Report
The Custom Excel Report solution extends the functionality of ConceptDraw PROJECT software and allows generating a tabular project report based on a custom Excel project report template. You can create equally easily the project overview report, project resources usage report, project status report, monthly or weekly project status report, or project status report example for another period, and more. CD Project add-in for MS Excel is convenient and efficient tool to create custom Excel report templates. The application of a custom Excel report template in ConceptDraw PROJECT allows generating a project report based on this template and the ConceptDraw PROJECT document data.
 Sales Flowcharts
The Sales Flowcharts solution lets you create and display sales process maps, sales process workflows, sales steps, the sales process, and anything else involving sales process management.
Sales Performance
Measuring sales performance is key task to see how your business can improve. Visualizing sales data with ConceptDraw Sales Dashboard you get a clear picture of sales performance.
 Status Dashboard
Status dashboard solution extends ConceptDraw DIAGRAM software with templates, samples and vector stencils libraries with graphic indicators for drawing the visual dashboards showing status data. The graphic Status Indicators (e.g., Alerts, Progress and Rating Indicators, and Traffic Lights) are the ones that can be always used by any ConceptDraw DIAGRAM user once taken from the mentioned solution.
Business Diagram Software
When managing the projects, people, or networks, there are daily designed and used different types of Business diagrams, so the powerful drawing software will be very useful for this. ConceptDraw DIAGRAM with large quantity of business solutions will meet your needs and will help you convey your ideas successful and rapidly, no matter are you professional or beginner. It is the best choice for business specialists and technical professionals who need quickly and easily explore, visualize, and communicate information. ConceptDraw DIAGRAM business diagram software is the most powerful business software and relational charting software. Create advanced, completely customizable Business Process Diagrams, Business Flow Charts, Work Flow Diagrams, Organizational Charts, Audit diagrams, Marketing diagrams, Value Stream Maps, TQM diagrams, ERD diagrams, EPC diagrams, Cause and Effect diagrams, Infographics, Dashboards, and other Relational business diagrams from your data using the powerful drawing tools of ConceptDraw Solution Park.
 Spatial Dashboard
The Spatial Dashboard solution extends ConceptDraw DIAGRAM software with templates, samples and vector stencils libraries with thematic maps for drawing visual dashboards showing spatial data. It also allows saving time and creating a dashboard simpler and quicker rather than to run a few different reports. The Spatial Dashboard solution is the one that helps to visualize the spatial info on Thematic Maps, showing the way some particular metric varies across territories.
 MindMap Diagrams
The MINDMAP Diagrams solution supplies ConceptDraw Solution Park and ConceptDraw MINDMAP software with a collection of samples and templates and mindmapping tools offering great opportunities for business, marketing, management, advertising, analytics, and sales. The MINDMAP diagrams collection includes Funnel Diagrams, PESTLE Analysis Diagrams, Stakeholder Onion Diagrams, Venn Diagrams, and Matrix Diagrams that help in projects development, planning and analyzing your project with Mind Map, visualizing the relationships that exist in the project environment, assigning stakeholders that impact the project and displaying their level of engagement, realignment, automation processes, and increasing profits.
 Fishbone Diagrams
The Fishbone Diagrams solution extends ConceptDraw DIAGRAM software with the ability to easily draw the Fishbone Diagrams (Ishikawa Diagrams) to clearly see the cause and effect analysis and also problem solving. The vector graphic diagrams produced using this solution can be used in whitepapers, presentations, datasheets, posters, and published technical material.
 ConceptDraw Solution Park
ConceptDraw Solution Park collects graphic extensions, examples and learning materials
Sales Dashboard - insight about potential opportunities and key sales operations
ConceptDraw Sales Dashboard gives you a clear insight about potential opportunities and key sales operations. Analysing sales KPI is a proven way to see how your business can improve.- How to Create a Sales Dashboard Using ConceptDraw PRO | KPIs ...
- How to Use ConceptDraw Sales Dashboard Solution | Sales Kpi Excel
- Dashboard | Sales Kpi Ppt Free Download
- Dashboard | Excel Kpi Dashboard Templates - Conceptdraw.com
- Logistic Dashboard | Key Performance Dashboard Excel
- HR Dashboard | Excel Metrics Dashboard Template
- How to Use ConceptDraw Sales Dashboard Solution | A KPI ...
- Logistic Dashboard | Kpi Dashboard Excel Templates
- KPI Dashboard | Exporting project data from ConceptDraw Project ...
- Fire and Emergency Plans | Safety Dashboard Excel Templates Free


