Marketing and Sales Organization chart. Organization chart Example
The use of Organization Charts is very popular at the fields of marketing and sales. They help to depict in a visual form a lot of information about organization: the company's structure, relationships of positions within an organization in terms of authorities and responsibilities, and company's strategies. All Organizational Charts are constructed from the similar building blocks (rectangles and lines), this makes them easily for interpretation and understanding by all interested people inside and outside of this company, such as shareholders, employees, investors, distributors, suppliers, customers, etc. Organization Charts can be hand-drawn on the paper, however the preferable is to use a special software. ConceptDraw PRO diagramming and vector graphics software extended with useful Organizational Charts solution is ideal for easy representing information and data, and professional drawing Marketing and Sales Organization Chart with any depth of detailing. Organizational structure may differ during the company's development, you can design and compare the charts on each stage.Geo Map Software
Geo Map Software - Full Geographic Reach of Your Business with Geo Map Shapes.Competitor Analysis
Competitor analysis is a first and obligatory step in elaboration the proper corporate marketing strategy and creating sustainable competitive advantage. Use powerful opportunities of numerous solutions from ConceptDraw Solution Park for designing illustrative diagrams, charts, matrices which are necessary for effective competitor analysis.Sales Process Flowchart. Flowchart Examples
Sales Process Flowchart is an invaluable tool for business. It gives you opportunity to visualise and better understand the sales process, reveal and also visually highlight issues or bottlenecks, and predict the number of sales. The Flowchart is ideal method to represent in details all steps of the process, tasks and decisions needed to obtain maximum effectiveness and success. The steps are graphically represented by boxes linked with arrows indicating direction of the workflow, decision is shown by diamond. The sales process is closely linked to the company's success and usually includes the following main steps: Product knowledge, Prospecting, Planning the sale (Pre-approach), Approach, Need assessment, Presentation, Meeting objections, Gaining commitment, Follow-up. Create fast and easy your own Flowcharts of sales business processes using the ConceptDraw PRO vector graphic software extended with Cross-Functional Flowcharts solution from Business Processes area and also Sales Flowcharts solution from Marketing area of ConceptDraw Solution Park.MindMap of Baden-Württemberg Districts
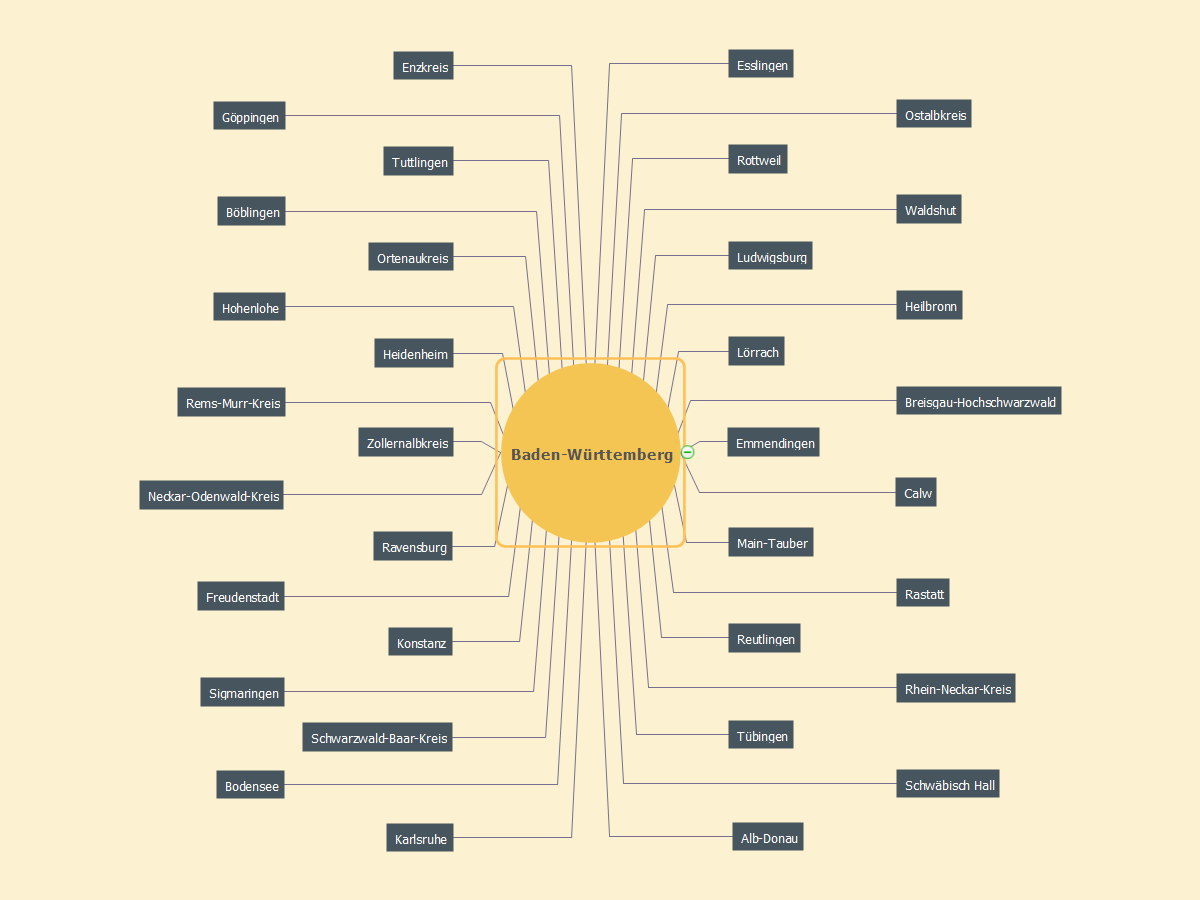
ConceptDraw MINDMAP software is ideal for designing various Mind Maps, for representing characteristics of different cities, regions, countries and continents. The Germany is not exception, the ConceptDraw MINDMAP assists in designing different Germany related Mind Maps. A given Mind Map is also created in ConceptDraw MINDMAP and illustrates the districts of Baden-Württemberg that is the Germany's state situated in the southwest and east of the Upper Rhine. Baden-Württemberg state is the third largest in Germany by size and population, Stuttgart is its capital. The list of districts contains Alb-Donau, Biberach, Bodensee, Böblingen, Breisgau-Hochschwarzwald, Calw, Enzkreis, Emmendingen, Esslingen, Freudenstadt, Göppingen, Heidenheim, Hohenlohe, Heilbronn, Karlsruhe, Konstanz (Constance), Ludwigsburg, Lörrach, Main-Tauber, Neckar-Odenwald-Kreis, Ostalbkreis, Ortenaukreis, Rastatt, Reutlingen, Ravensburg, Rems-Murr-Kreis, Rhein-Neckar-Kreis, Rottweil, Sigmaringen, Schwäbisch Hall, Schwarzwald-Baar-Kreis, Tuttlingen, Tübingen, Waldshut, Zollernalbkreis.
 UK Map
The Map of UK solution contains collection of professionally designed samples and scalable vector stencil graphics maps, representing the United Kingdom counties, regions and cities. Use the Map of UK solution from ConceptDraw Solution Park as the base fo
Cross-Functional Flowchart
Use of Cross-Functional Flowchart is a clear way of showing each team member’s responsibilities and how processes get shared or transferred between different responsible people, teams and departments. Use the best flowchart maker ConceptDraw PRO with a range of standardized cross-functional flowchart symbols to create the Cross-Functional Flowcharts simply and to visualize the relationship between a business process and the functional units responsible for that process. To draw the most quickly Cross-Functional Flowcharts, Cross Functional Process Maps, or Cross Functional Process Flow Diagrams, start with a Cross-functional flowchart samples and templates from ConceptDraw Solution Park. The ConceptDraw Arrows10 and RapidDraw technologies will be also useful for you in drawing. ConceptDraw PRO supports designing both types - horizontal and vertical Cross-functional flowcharts. A vertical layout makes the accents mainly on the functional units while a horizontal layout - on the process. If you need a Visio alternative in Mac OS X, try ConceptDraw PRO. Its interface is very intuitive and it’s actually much easier to use than Visio, yet somehow it’s just as powerful if not more so. ConceptDraw PRO performs professional quality work and seamless Visio interaction.
 Continent Maps
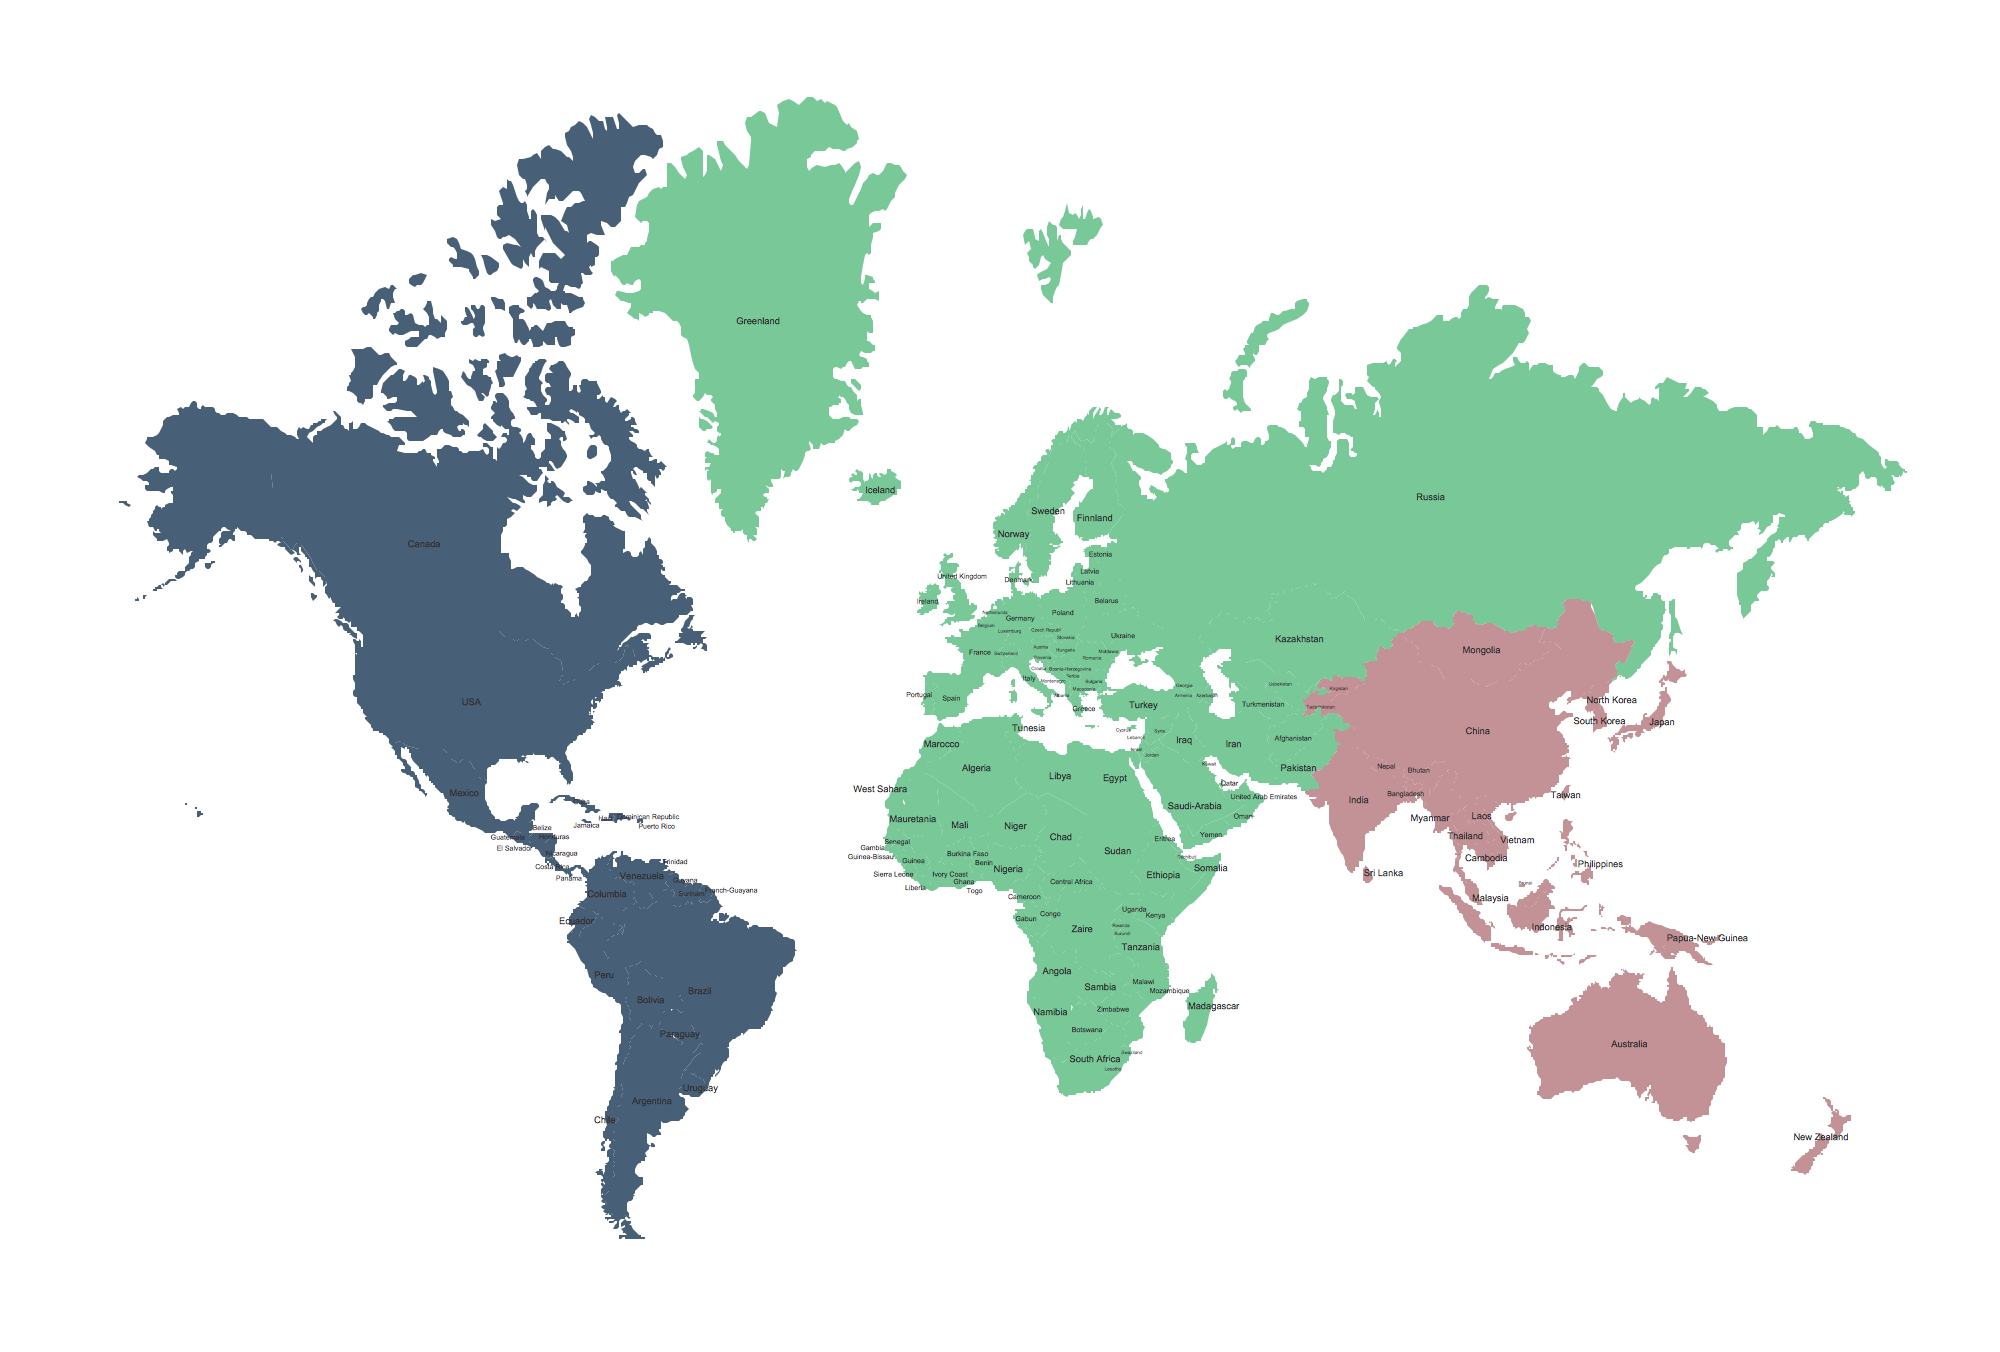
Continent Maps solution extends ConceptDraw PRO software with templates, samples and libraries of vector stencils for drawing the thematic maps of continents, state maps of USA and Australia.
 Sales Dashboard
Sales Dashboard solution extends ConceptDraw PRO software with templates, samples and library of vector stencils for drawing the visual dashboards of sale metrics and key performance indicators (KPI).
Geo Map - Australia - Nothern Territory
Use the Australia library to draw thematic maps, geospatial infographics and vector illustrations for your business documents, presentations and websites.- Continent Maps | Canada Sales Territories Map
- Swot Analysis Sales Territory
- Territory Mapping Software Free Australia
- Land sales process flowchart | Vehicular Networking | Germany Map ...
- Canada regions - Political map | Geo Map - Canada - British ...
- USA Maps | Continent Maps | Germany Map | Sales By State Map
- Map of UK — England Regions and counties | Map of England | UK ...
- Sales Process Flowchart. Flowchart Examples | Sales Process Map ...
- Swot Analysis In Sales


