Empower Your Sales Team With a Sales Dashboard
ConceptDraw Sales Dashboard solution allows you empower your sales team with a sales dashboard that visualizes all team and personal KPI your team need to work effectively.A KPI Dashboard Provides the Answers Your Sales Team
Sales dashboard is a tool that provides the answers to all questions your sales team may have. A mature sales dashboard provides complete set of KPI to shows corporate, team or personal performance to keep sales process clear.Sales Teams are Inherently Competitive
Sales teams are inherently competitive, so you don't need to invent extra ways to stimulate the competition. At the same time, you can provide the team with a sales dashboard shows company, team and personal KPI to make the competition clear.Sales Dashboard Solutions can help your sales team keep an eye on performance
ConceptDraw Sales Dashboard Solution is a simple and effective way of visualizing sales data and get clear picture of your sales process to see how your business can improve.Business Productivity - Marketing
Mind Map is effective tool for depiction the main idea and related concepts, and representation a thought process. Mind Maps have essential value in marketing field, advertising and sales. They help successfully accomplish marketing goals and easy get marketing answers, to achieve a sustainable competitive advantages and increasing sales. Mind Maps help in new product development, they allow to generate and structure ideas about its properties and features, to define the target customers, brainstorm the key words and phrases for advertising and sales materials. ConceptDraw MINDMAP is a perfect marketing diagramming and marketing strategy tool that help accomplish marketing goals, represent marketing information and easy design Marketing Mind Maps and Marketing Diagrams (Marketing Step Chart, Marketing Mix Diagram, Market Environment Analysis Charts, Sales Pyramids, Target and Marketing Scope Diagrams, Feature Comparison Chart, Product Position Map, Products Comparison Chart, Timeline, SWOT, Boston Growth Matrix, Ansoff Product-Market Growth Matrix) for further using in visual documents and presentations.Ways You Can Visualize Sales Data
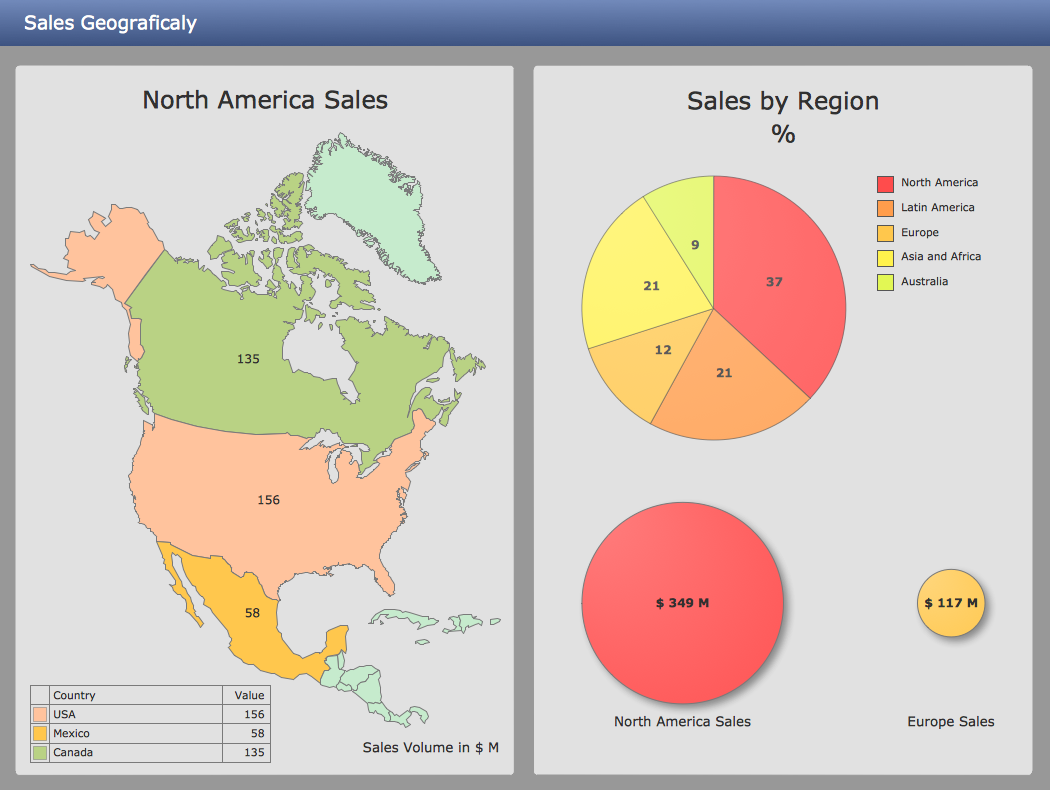
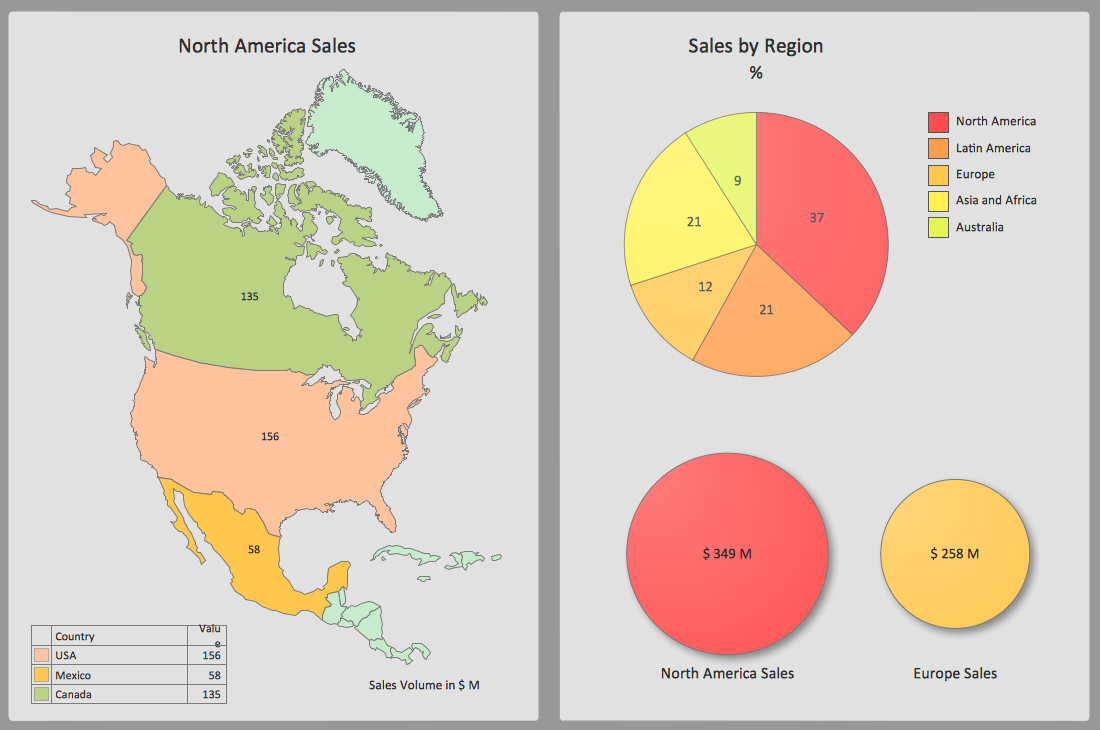
There are lots of ways you can visualize sales data, and the simplest way is using ConceptDraw Sales Dashboard solution for ConceptDraw PRO. You just need to connect your data to one of pre-designed dashboards, and then you can see dynamic picture of changes.Sales KPI Dashboards
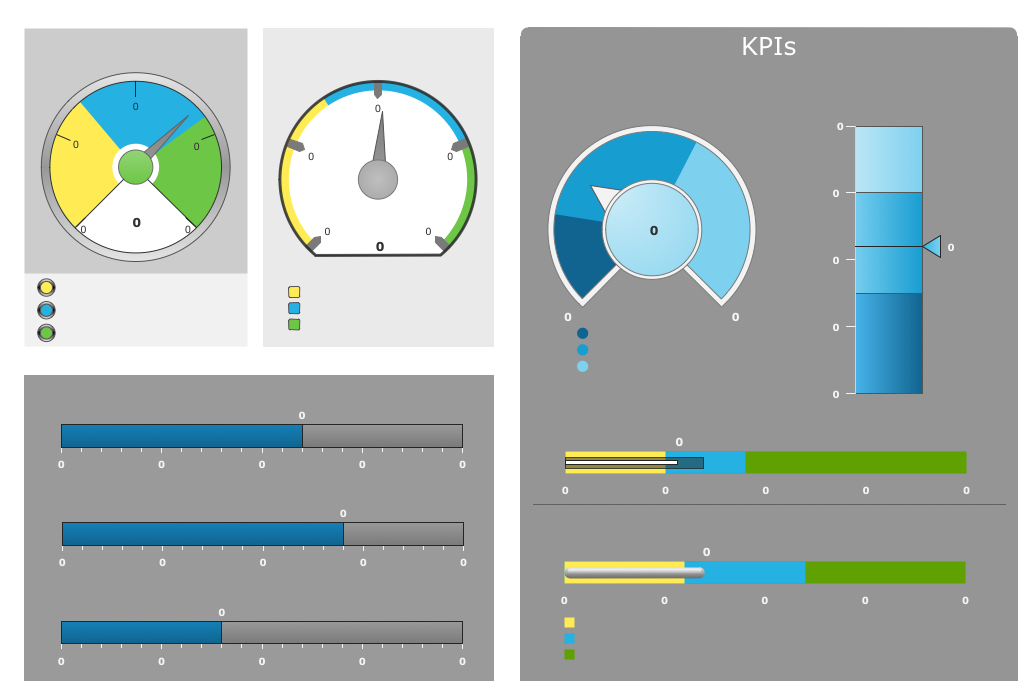
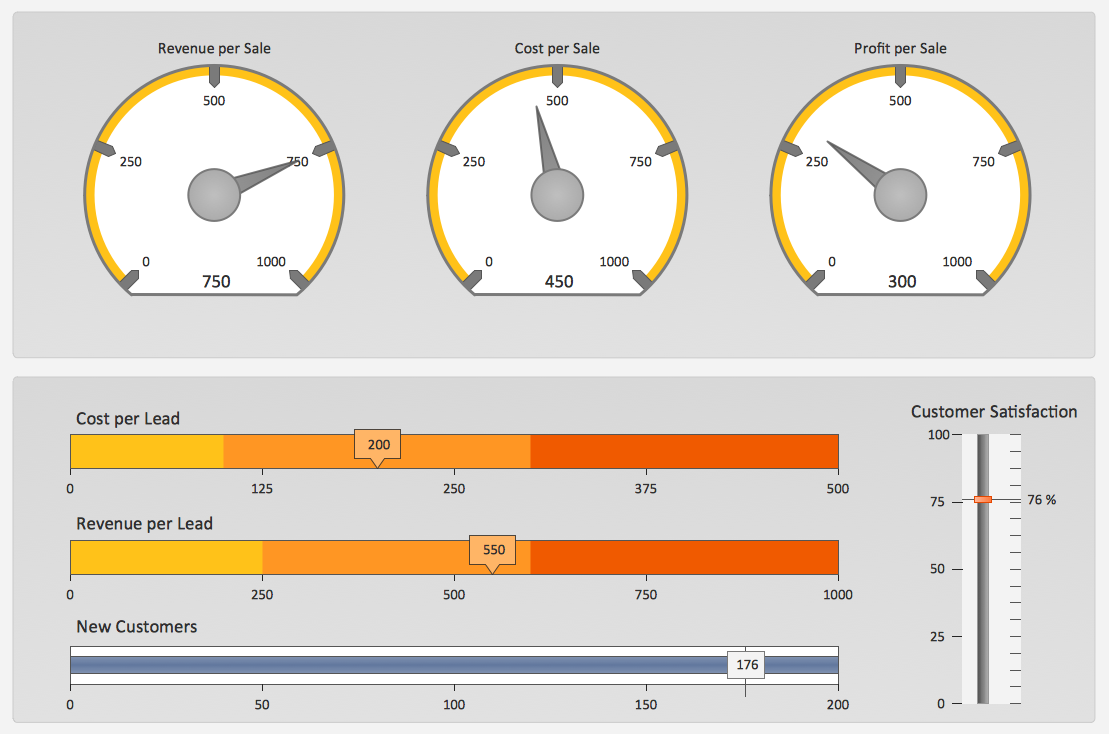
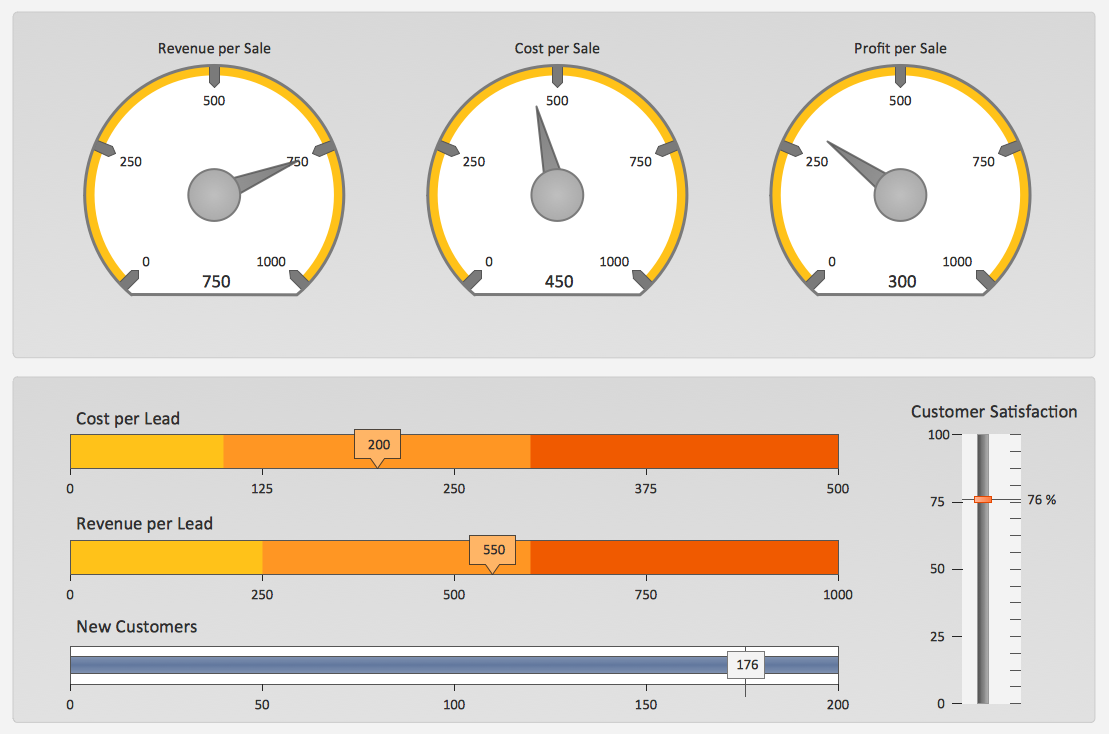
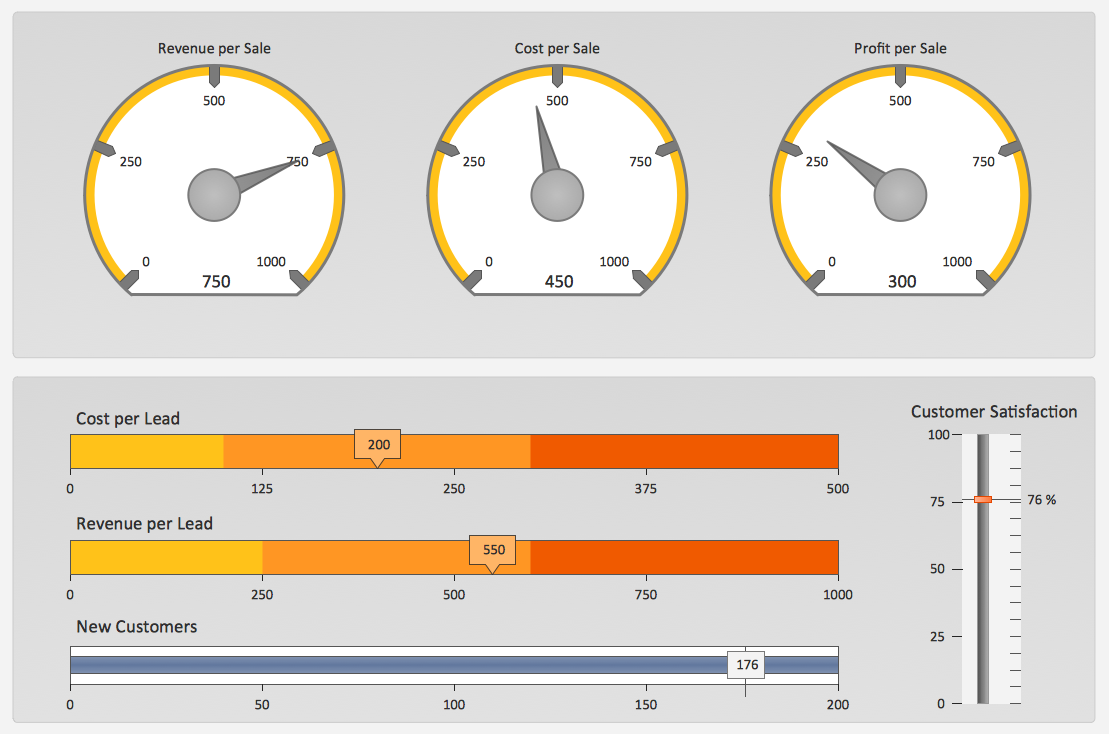
A combination of sales KPI on a one dashboard helps you track sales activities and results. Visualizing sales data using ConceptDraw PRO software extended with the Sales Dashboard solutiongives you flexibility in choosing and tuning KPIs.Sales Dashboard Examples
Visualizing sales data you may need a good example to start. ConceptDraw Sales Dashboard solution delivers a complete set of templates and samples you can use as examples to start composing your own sales dashboard.A KPI Dashboard
Composing a dashboard from different KPI is a kind of art. Visualizing sales data you have to keep balance to keep your dashboard informative, not messy. ConceptDraw Sales Dashboard solution gives you a set of good examples of balanced dashboards.Customer Relationship Management
Customer relationship management is an important component of sales success. Visualizing sales data you may put some KPI related to customers relationship management to your Sales dashboard and track this important aspect in real time.- Sales Flowcharts | Sales Team Vector Png
- Entity-Relationship Diagram (ERD) | Sales Flowcharts | Customer ...
- How to Create a Sales Dashboard Using ConceptDraw PRO | Sell ...
- Customer Relationship Management Vector Png
- Sales Flowcharts | The Action Plan | PROBLEM ANALYSIS ...
- Business people pictograms - Vector stencils library | Sales KPIs ...
- Sales Marketing Vector Png
- Strategy Vector Png
- Business people pictograms - Vector stencils library | People ...
