Competitor Analysis
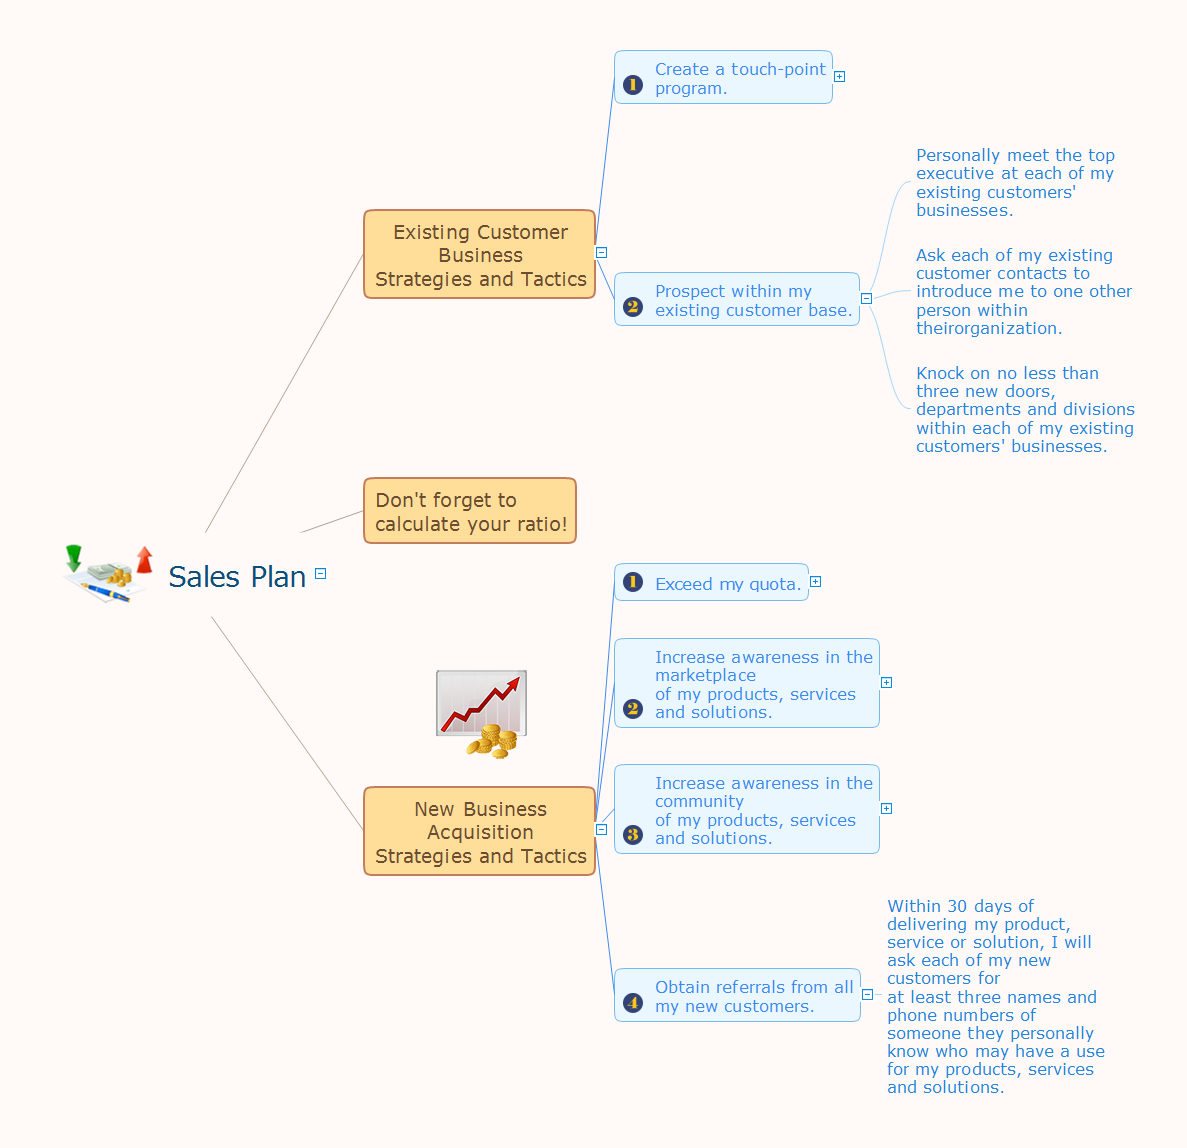
Competitor analysis is a first and obligatory step in elaboration the proper corporate marketing strategy and creating sustainable competitive advantage. Use powerful opportunities of numerous solutions from ConceptDraw Solution Park for designing illustrative diagrams, charts, matrices which are necessary for effective competitor analysis.Sales Plan
The welfare of the entire company depends on the work of sales department, since the volume of sales sets the level of incomes. The realistic and competently composed sales plan is a component of success, prosperity and stability of the company. The sales plan will help to define specific goal for development of organization for a specified period of time and to define the boundaries of possibilities. The business inevitably faces with various contingencies, but the task of sales department is to maximize the use of existing resources for successful realizing the sales plan. When constructing the sales plan, you should carefully analyze the macroeconomic and political trends, to study the situation on the market and forecasts for dynamics, to take in account the results of competitors, to carefully consider results of work of sales department for the last years and the pace of company's development, to analyze the causes of growth or decline of sales in certain periods. Set the realistic goals and make the sales plan easily in ConceptDraw MINDMAP , don't forget to include to the budget the expenses on sales, such as the costs for advertising, supplies, salaries and bonuses. Save your plan in the form of presentation for easy discussion with other employees of the company.
 Sales Dashboard
Sales Dashboard solution extends ConceptDraw DIAGRAM software with templates, samples and library of vector stencils for drawing the visual dashboards of sale metrics and key performance indicators (KPI).
 Australia Map
For graphic artists creating accurate maps of Australia. The Australia Map solution - allows designers to map Australia for their needs, offers a collection of scalable graphics representing the political geography of Australia, split into distinct state
Sales Process Flowchart. Flowchart Examples
Sales Process Flowchart is an invaluable tool for business. It gives you opportunity to visualise and better understand the sales process, reveal and also visually highlight issues or bottlenecks, and predict the number of sales. The Flowchart is ideal method to represent in details all steps of the process, tasks and decisions needed to obtain maximum effectiveness and success. The steps are graphically represented by boxes linked with arrows indicating direction of the workflow, decision is shown by diamond. The sales process is closely linked to the company's success and usually includes the following main steps: Product knowledge, Prospecting, Planning the sale (Pre-approach), Approach, Need assessment, Presentation, Meeting objections, Gaining commitment, Follow-up. Create fast and easy your own Flowcharts of sales business processes using the ConceptDraw DIAGRAM ector graphic software extended with Cross-Functional Flowcharts solution from Business Processes area and also Sales Flowcharts solution from Marketing area of ConceptDraw Solution Park.
 Business Package for Management
Package intended for professional who designing and documenting business processes, preparing business reports, plan projects and manage projects, manage organizational changes, prepare operational instructions, supervising specific department of an organization, workout customer service processes and prepare trainings for customer service personal, carry out a variety of duties to organize business workflow.
Geo Map - Australia
The vector stencils library Australia contains contours of New Zealand and Australian states and mainland territories for ConceptDraw DIAGRAM diagramming and vector drawing software.Flowchart Example: Flow Chart of Marketing Analysis
An example flowchart of marketing analysis shows main steps you have to challenge writing a marketing analysis.
 Education Package
Education Package is a comprehensive set of multifarious graphical solutions from ConceptDraw Solution Park, collected together in help to ConceptDraw DIAGRAM users working in a field of science, education and training, which is aimed at improving the quality of education and helping to design with ease variety of interesting and colorful educational materials, diagrams, charts and maps. Use it to present the information and knowledge in an interesting, clear, structured and simple form to achieve a success in education and pedagogy, to maintain the interest of students and pupils throughout the whole learning process, at the lectures, lessons and even during independent work with additional materials, to contribute to better perception of scientific information by listeners during the conferences and reports.
- Swot Analysis In Sales
- Sales Plan | How to Deliver Presentations using Mind Maps | Mind ...
- ConceptDraw Solution Park | Microsoft Word Sales Sales Territory ...
- Marketing | Seven Management and Planning Tools | Sales Analysis ...
- Sales On Map
- Sales Map
- Types of Flowchart - Overview | Geo Map - Africa | Sales Process ...
- The Sales Process | SWOT Sample in Computers | SWOT Analysis ...
- Sales Dashboard Template | KPI Dashboard | KPIs and Metrics | Ppt ...
- Presentation Of Data And Information Of Partnership Firm Process


