 Circle-Spoke Diagrams
Examples of subject areas that are well suited to this approach are marketing, business, products promotion, process modeling, market, resource, time, and cost analysis. Circle-Spoke Diagrams are successfully used in presentations, conferences, management documents, magazines, reportages, reviews, reports, TV, and social media.
Fishbone Diagram Template
A causal model is an abstract concept, that describes the causal mechanisms of a system, by noting certain variables and their influence on each other, in an effort to discover the cause of a certain problem or flaw. This model is presented in diagram form by using a fishbone diagram. ConceptDraw PRO diagramming and vector drawing software enhanced with Fishbone Diagrams solution helps you create business productivity diagrams from Fishbone diagram templates and examples, that provide to start using of the graphic method for the analysis of problem causes. Each predesigned Fishbone Diagram template is ready to use and useful for instantly drawing your own Fishbone Diagram.
 Calendars
Calendars solution extends ConceptDraw PRO software with templates, samples and library of vector stencils for drawing the business calendars and schedules.
 Basic Circle-Spoke Diagrams
Basic circle-spoke diagrams are well suited for marketing, management documents, and presentations.
How to Draw an Effective Flowchart
Use ConceptDraw PRO diagramming and business graphics software to draw your own flowcharts of business processes.
 Fishbone Diagram
Fishbone Diagrams solution extends ConceptDraw PRO software with templates, samples and library of vector stencils for drawing the Ishikawa diagrams for cause and effect analysis.
Business Calendar
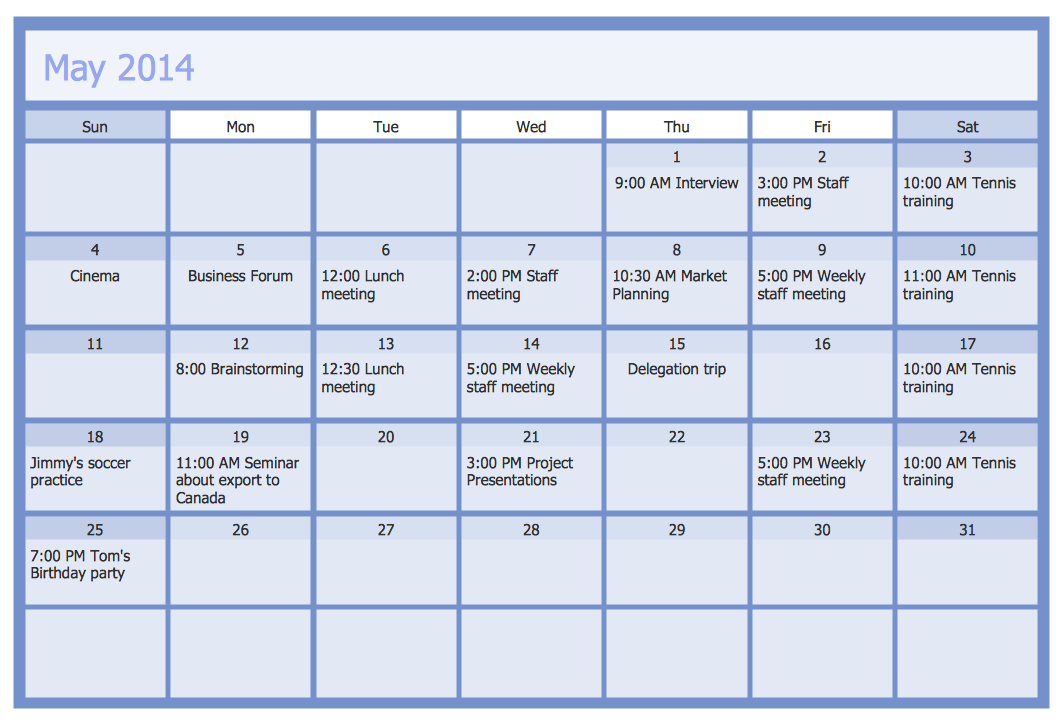
Business calendar is a special type of calendar, it must be functional, convenient for scheduling the affairs and meetings, and also must have strict, official and unobtrusive interface. So you must pay special attention to the business calendar design. Now you don't need to be an artist to design business calendar thanks to the unique drawing tools of Calendars Solution for ConceptDraw PRO diagramming and vector drawing software.
 Pie Charts
Pie Charts are extensively used in statistics and business for explaining data and work results, in mass media for comparison (i.e. to visualize the percentage for the parts of one total), and in many other fields. The Pie Charts solution for ConceptDraw PRO v10 offers powerful drawing tools, varied templates, samples, and a library of vector stencils for simple construction and design of Pie Charts, Donut Chart, and Pie Graph Worksheets.
HelpDesk
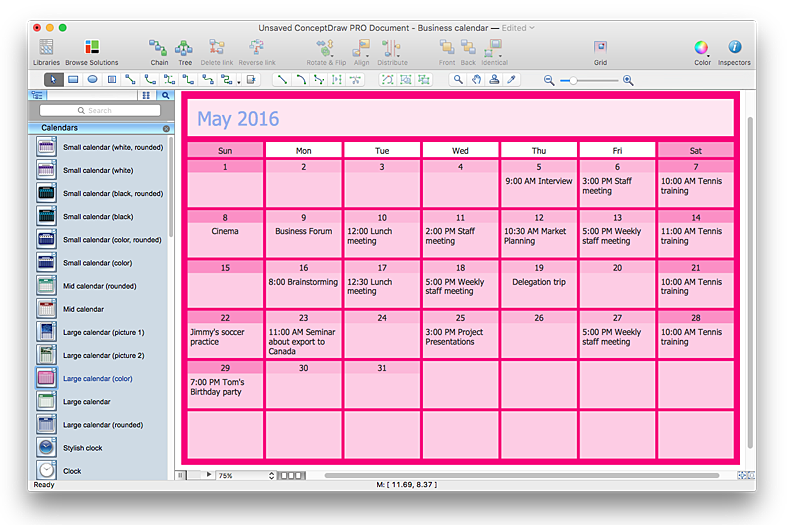
How to Create and Customize a Calendar in ConceptDraw PRO
ConceptDraw PRO has a large selection of various shapes, objects and clip-arts. It also has a tool that helps you find exactly what you need. ConceptDraw PRO has calendar objects available, and it’s very easy to customize it and set your dates. The ability to create a custom calendars is delivered by the Calendars solution. With the help of ConceptDraw PRO you can create a calendar that helps you plan your day / week / month and do not forget about the important things in life. For any day in your custom calendar, you can create a task list and add hyperlinks to a relevant information.
Video Lessons
How To Create Onion Diagram
An onion diagram is a kind of chart that shows the dependencies among parts of an organization or process. The chart displays items in concentric circles, where the items in each ring depend on the items in the smaller rings. The Onion Diagram is able to show layers of a complete system in a few circles. But how to create Onion Diagram? Now, it's very easy thanks to the ConceptDraw PRO diagramming and vector drawing software extended with Stakeholder Onion Diagrams Solution from the Management Area of ConceptDraw Solution Park.Organizational Structure Diagram Software
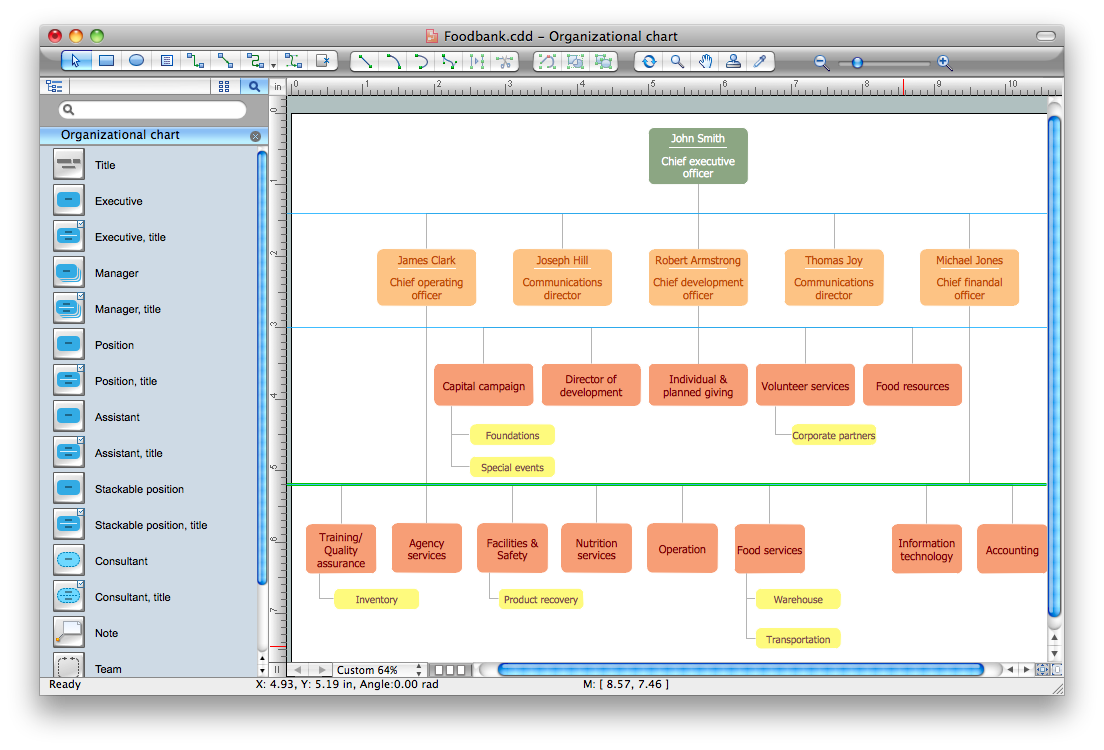
ConceptDraw PRO extended with Organizational Charts Solution from the Management Area is a powerful but easy-to-use Organizational Structure Diagram Software. Organizational Charts Solution provides a wide variety of templates and samples and large quantity of predesigned vector objects to help you design your Organizational Structure Diagrams and other business diagrams.
HelpDesk
How to Change the Working Time in a Project
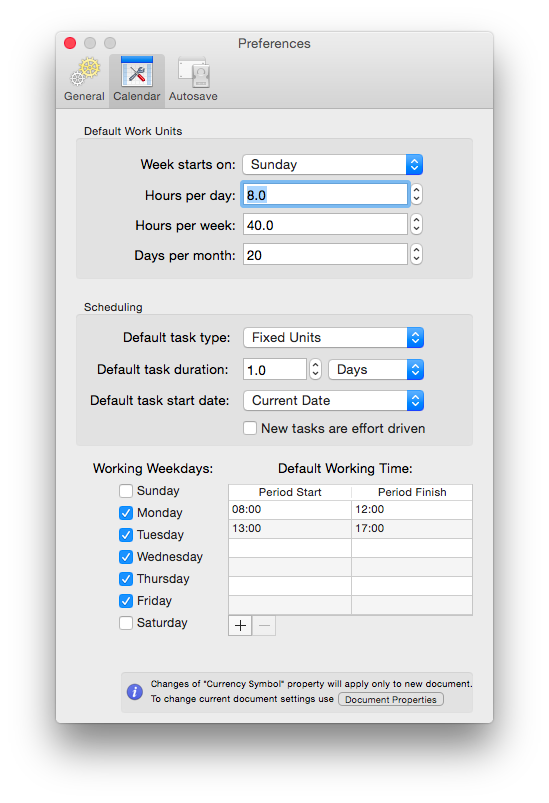
Project calendar determines working and non-working time of the project. It is used as a base to the project schedule development. There two types of project calendars: Project Calendar - which sets the working time for the whole project; and the Resource Calendar- which sets the working time of the particular project resource. The following article describes how to change the default calendar in ConceptDraw PROJECT.
 Windows 10 User Interface
Windows 10 User Interface solution extends significantly ConceptDraw PRO v11 functionality with look-and-feel functions of GUI software and makes it a great assistant for Win10 designers, developers, and software engineers. This solution provides a wide s
 iPhone User Interface
iPhone User Interface solution extends ConceptDraw PRO v10 software with templates, samples and libraries with large quantity of vector stencils of graphical user interface elements, Apps icons, UI patterns for designing and prototyping of the iOS applic
HelpDesk
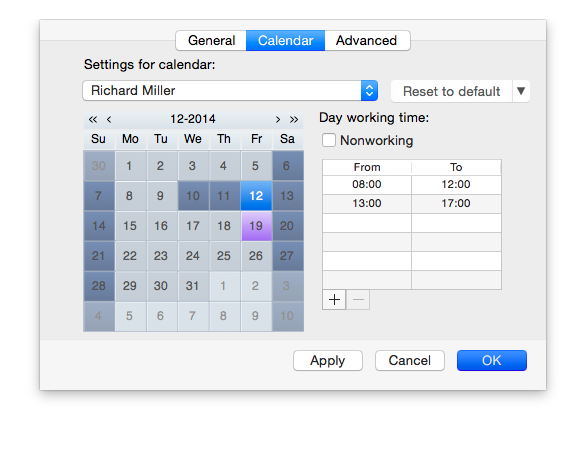
How to Create an Individual Resource Calendar
ConceptDraw PROJECT allows you to modify common working hour schedules individually for each employee.- Blank Calendar Template | Business Calendar | Fishbone Diagram ...
- Png Circle Chart Blank
- Pie Charts | Blank Calendar Template | Scatter Graph Charting ...
- Circle In Clouds Png
- Circle White Png
- Money Circle Png
- Small Circle Png
- White Circle Png Vector
- Circle Laptop Png
- Bar Diagrams for Problem Solving. Create economics and financial ...
- Target Diagram | Circle Spoke Diagram Template | Circular Diagram ...
- Phases of the moon | Calendars - Vector stencils library | Calendars ...
- Economics Png
- Research cycle - Circle diagram | Presentation design elements ...
- Circle Pie Chart Example For Ecomomic
- Circle Spoke Diagram Template | Best Diagramming | Pie Chart ...
- App Vector Circle Png
- Six Markets Model Chart Template | Target Diagram | Pyramid ...
- Research cycle - Circle diagram | Process Flowchart | Presentation ...
- Economic sector weightings | Bar Diagrams for Problem Solving ...


