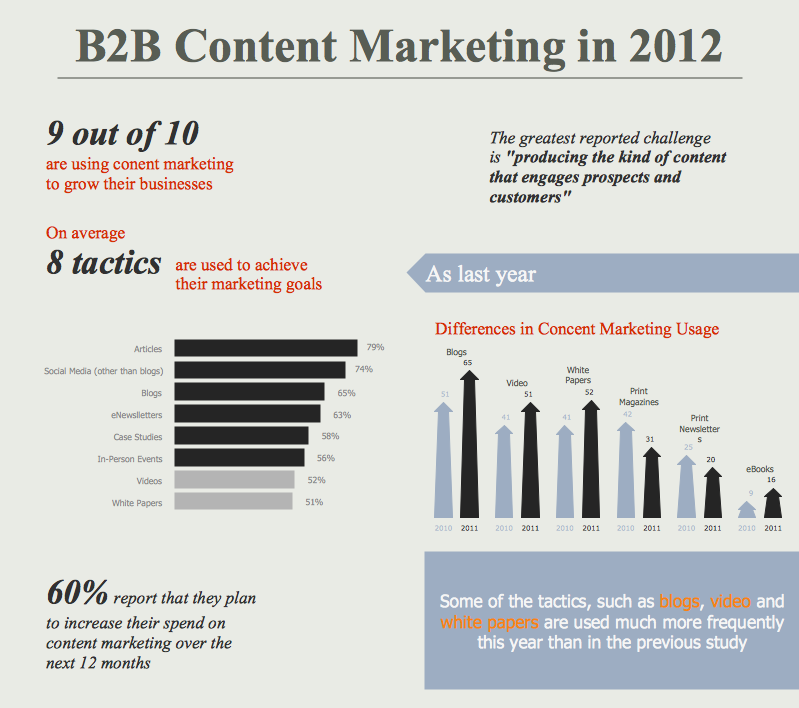
Content Marketing Infographics
The popularity of visual content marketing grows day by day. So now simple and convenient designing of professional looking Content Marketing Infographics becomes increasingly actual. For achievement this goal ConceptDraw DIAGRAM software offers the Marketing Infographics Solution from the Business Infographics Area.Marketing Flow Chart
ConceptDraw DIAGRAM diagramming and vector drawing software extended with Marketing Diagrams Solution from the Marketing Area of ConceptDraw Solution Park is the best software for quick and easy creating Marketing Flow Chart of any complexity and design. This charts created to define marketing project stages. In small business project management it sometimes generated by simple marketing project management software. Here is samples which included in Marketing Area of ConceptDraw Solution Park and it can be used as for project planning software as for project management report.UML Use Case Diagram Example - Estate Agency
UML Diagram Estate Agency. This sample was created in ConceptDraw DIAGRAM diagramming and vector drawing software using the UML Use Case Diagram library of the Rapid UML Solution from the Software Development area of ConceptDraw Solution Park. This sample shows the work of the estate agency and is used by the estate agencies, building companies, at the trainings of the estate agencies, for understanding the working processes of the estate agencies.Flowchart of Products. Flowchart Examples
This sample shows the Flowchart of the Sustainment and Disposal. A Flowchart is a graphically representation of the process that step-by-step lead to the solution the problem. The geometric figures on the Flowchart represent the steps of the process and are connected with arrows that show the sequence of the actions. The Flowcharts are widely used in engineering, architecture, science, analytics, government, politics, business, marketing, manufacturing, administration, etc.Flowchart Marketing Process. Flowchart Examples
This sample shows the Flowchart that displays the layout and work flow of the cloud marketing platform. This diagram has a style of the marketing brochure. This style displays the central product that is related to the other issues. Using the ready-to-use predesigned objects, samples and templates from the Flowcharts Solution for ConceptDraw DIAGRAM you can create your own professional looking Flowchart Diagrams quick and easy.Yourdon and Coad Diagram
The vector stencils library Yourdon and Coad Notation from the solution OOAD contains specific symbols of the Yourdon and Coad notation such as data store symbol, data process symbol, loop symbol for ConceptDraw DIAGRAM diagramming and vector drawing software. The OOAD solution is contained in the Software Development area of ConceptDraw Solution Park.Target Diagram
Target Diagram is a convenient and visual way of presentation information which is popular and widely used in marketing, business and economics. ConceptDraw DIAGRAM diagramming and vector drawing software extended with Target and Circular Diagrams solution from the Marketing area of ConceptDraw Solution Park is ideal for fast and easy drawing a Target Diagram.The Sales Process
The Sales Process is a complex approach for selling a product or service which assumes many steps including the sales planning, realization of the sales marketing and management strategies, sales process analysis, etc. Now we have a ConceptDraw DIAGRAM software extended with unique Sales Flowcharts solution from the Marketing area of ConceptDraw Solution Park which ideally suits for the planning and realization the company's sales process.Business Process Flow Diagram
Business Process Flow Diagram is a graphical presentation of business processes and process flows. It is one of the main tool of business analysis and business process re-engineering that lets identify and easy understand process flows within organization. ConceptDraw DIAGRAM extended with Business Process Workflow Diagrams solution from the Business Processes area of ConceptDraw Solution Park is a powerful software which lets easy design Business Process Flow Diagram of any complexity.Software for Creating SWOT Analysis Diagrams
SWOT analysis or alternatively SWOT matrix is a simple, but useful tool for auditing an organization and its environment, for analyzing its strengths and weaknesses, opportunities and threats that can appear. A SWOT analysis can be executed for an industry, product, place, or person. It is a first stage of planning which helps the marketing specialists to focus on the key issues. SWOT analysis includes the identification of objectives of the project or business venture, specification of internal and external factors favorable and vice versa unfavorable for achievement the designated goal. ConceptDraw DIAGRAM ector graphics software enhanced with SWOT and TOWS Matrix Diagrams solution from Management area of ConceptDraw Solution Park is a powerful software for creating SWOT analysis diagrams. Ready-to-use templates, samples and examples allow create your own TOWS and SWOT matrices in minutes. The integration between ConceptDraw MINDMAP and ConceptDraw DIAGRAM applications will be also helpful for easier drawing.Marketing - Design Elements
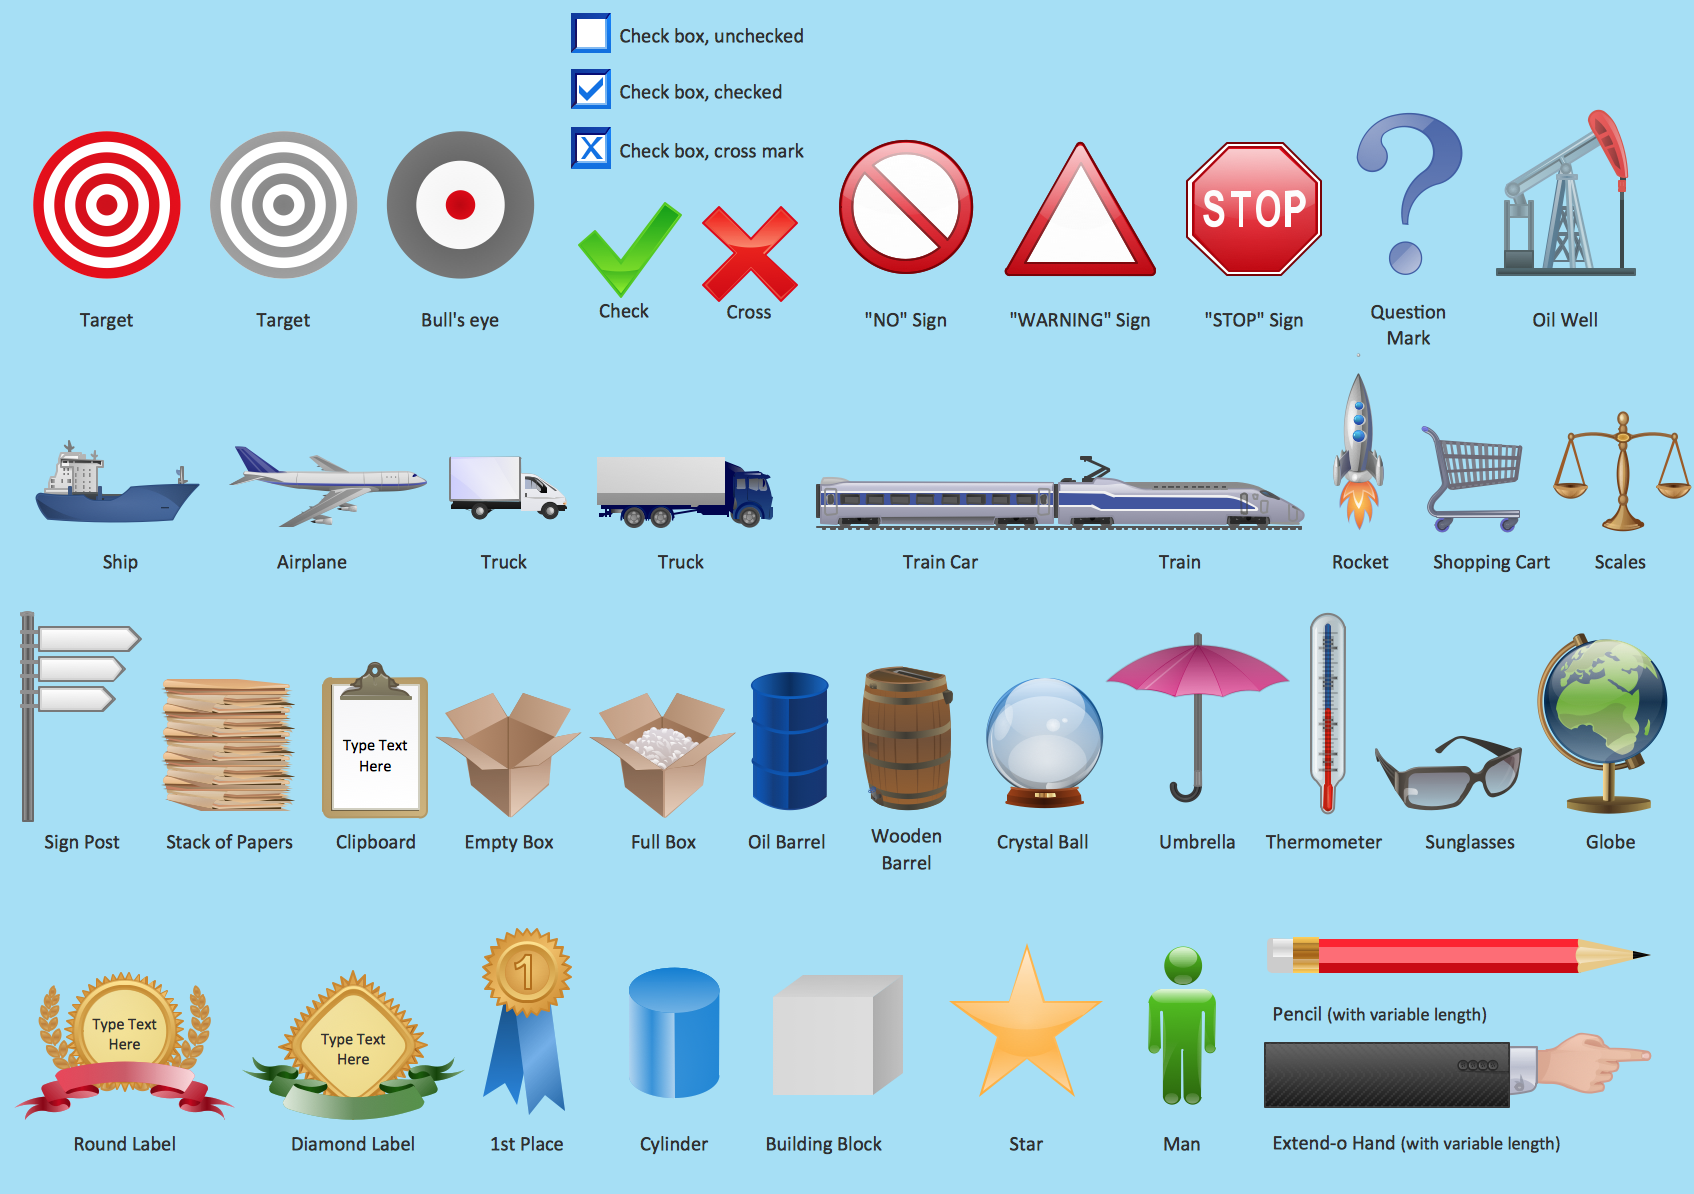
If you need to pull together a quick marketing drawing, you'll find elements, samples, templates and libraries with vector clip art for drawing the Marketing Illustrations. These symbols and signs you can use in your design for Strategic Marketing, Graphic Design, Inbound and Content Marketing, Social Media, Lead Generation, Email Marketing and Automation, CRM implementation and Integration and more. This symbols used for marketing presentation, project management report, project management tracking tools and other types of creative project management software.Marketing and Sales Organization chart. Organization chart Example
The use of Organization Charts is very popular at the fields of marketing and sales. They help to depict in a visual form a lot of information about organization: the company's structure, relationships of positions within an organization in terms of authorities and responsibilities, and company's strategies. All Organizational Charts are constructed from the similar building blocks (rectangles and lines), this makes them easily for interpretation and understanding by all interested people inside and outside of this company, such as shareholders, employees, investors, distributors, suppliers, customers, etc. Organization Charts can be hand-drawn on the paper, however the preferable is to use a special software. ConceptDraw DIAGRAM diagramming and vector graphics software extended with useful Organizational Charts solution is ideal for easy representing information and data, and professional drawing Marketing and Sales Organization Chart with any depth of detailing. Organizational structure may differ during the company's development, you can design and compare the charts on each stage.Flowchart Example: Flow Chart of Marketing Analysis
An example flowchart of marketing analysis shows main steps you have to challenge writing a marketing analysis.Marketing Organization Chart
You need design the Marketing Organization Chart and look for effective software? Now it's incredibly easy to do this in ConceptDraw DIAGRAM which was supplied with Marketing Diagrams Solution from the Marketing Area of ConceptDraw Solution Park.Six Markets Model Chart
This sample shows the Six Markets Model Chart. It was created in ConceptDraw DIAGRAM diagramming and vector drawing software using the Marketing Diagrams Solution from the Marketing area of ConceptDraw Solution Park. The six markets model defines six markets that take the central place in the relationship marketing: internal markets, supplier markets, recruitment markets, referral markets, influence markets and customer markets. The six markets model allows the organization to analyze the stakeholders and key market domains that can be important to it. This model used in marketing project management software for small business project management.Entity Relationship Diagram Examples
Creation of Entity-Relationship (ER) model is a visual representation the structure of a business database, where data equates to entities or objects, which are linked by defined relationships expressing dependencies and requirements. By the nature, the ER model is an abstract visualization, a first step in design process towards creating a logical and functional database. ConceptDraw DIAGRAM professional software gives the ability to effectively describe a database using the Entity-Relationship model. Included to ConceptDraw Solution Park, the Entity-Relationship Diagram (ERD) solution contains the set of predesigned vector icons advocated by Chen's and Crow’s Foot notations that both can be used for data modeling and describing a database. Entity-Relationship Diagram (ERD) solution includes also helpful templates and incredibly large collection of varied Entity Relationship Diagram examples and samples offered at ConceptDraw STORE. Each of them can be used to develop your own model of a database of arbitrary complexity.
Entity Relationship Diagram Examples
ConceptDraw DIAGRAM diagramming and vector drawing software offers the Entity-Relationship Diagram (ERD) Solution from the Software Development Area for ConceptDraw Solution Park. How many examples contains the Entity-Relationship Diagram (ERD) Solution! All Entity Relationship Diagram examples were designed and saved for ConceptDraw DIAGRAM users. Now they are available from ConceptDraw STORE.Entity Relationship Diagram Software Engineering
Entity Relationship Diagram (aka ER Diagram, E-R Diagram, ERD) is a time-tested and widespread software development and software engineering method for data modeling, illustrating the logical structure of databases and system design. For ERDs construction are used three basic elements: entities, attributes, and relationships. Chen's notation for ERD supposes the use of rectangles (boxes) to represent entities and diamonds to depict relationships between first-class objects. This notation is popular when creating conceptual data models of information systems. Another standardized notation for ER diagrams is Crow's foot notation. ConceptDraw DIAGRAM as a powerful Entity Relationship Diagram software engineering provides the tools of Entity-Relationship Diagram (ERD) solution from Software Development area of ConceptDraw Solution Park for instantly describing databases using ERDs of Crow’s Foot and Chen’s notations. Use the predesigned vector elements for both these notations from 2 libraries included to Entity-Relationship Diagram (ERD) solution.
 Entity-Relationship Diagram (ERD)
An Entity-Relationship Diagram (ERD) is a visual presentation of entities and relationships. That type of diagrams is often used in the semi-structured or unstructured data in databases and information systems. At first glance ERD is similar to a flowch
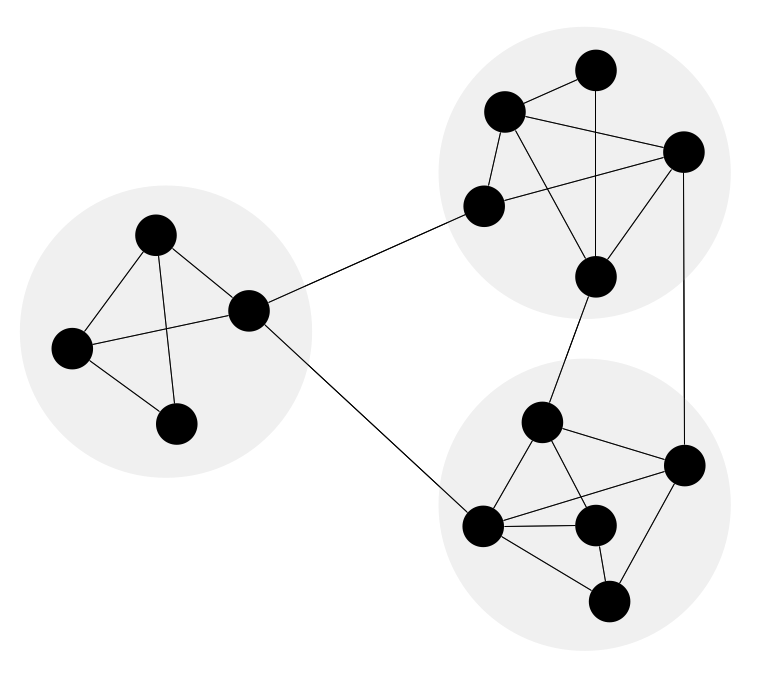
Network Community Structure. Computer and Network Examples
Network community structure is a network which nodes can be easily grouped into the sets of nodes with dense internally connections. This example shows a network that displays the community structure with three groups of nodes with dense internal connections and sparser connections between the groups.
- Er Diagram Of Online Marketing System
- Marketing Management System Er Diagram
- Entity-Relationship Diagram ( ERD ) | ConceptDraw PRO | Entity ...
- Entity-Relationship Diagram ( ERD ) | Marketing Sale Relationship
- Example Erd Of Sales And Marketing System
- Er Diagram For Online Marketing Management
- Er Diagram For Marketing Management System
- The Sales Process | Entity-Relationship Diagram ( ERD ) with ...
- Erd For Market Management System
- Er Diagram For Small Marketing Company
- Marketing Campaign Management System Er Diagram
- Flowchart Marketing Process. Flowchart Examples | Er Diagram Of ...
- Erd Marketing
- Business Process Diagrams | Fishbone Diagram | Rapid UML ...
- Erd Of Marketing Point Of Sale System
- Flowchart Marketing Process. Flowchart Examples | Examples of ...
- Flow chart Example . Warehouse Flowchart | Flowchart Marketing ...
- Er Diagram Of E Marketing
- Entity Relationship Diagram Examples | Data Modeling with Entity ...


