 Fishbone Diagram
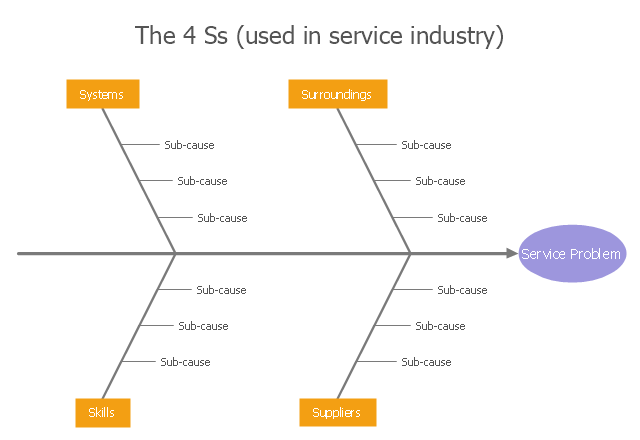
Fishbone Diagrams solution extends ConceptDraw DIAGRAM software with templates, samples and library of vector stencils for drawing the Ishikawa diagrams for cause and effect analysis.
"Causes in the diagram are often categorized, such as to ...
The 5 Ss (used in service industry):
(1) Samples;
(2) Scheme;
(3) Synchronous;
(4) Skin;
(5) Search." [Ishikawa diagram. Wikipedia]
This service 4 Ss Ishikawa diagram (cause and effect diagram) template is included in the Fishbone Diagram solution from the Management area of ConceptDraw Solution Park.
 Management
This solution extends ConceptDraw DIAGRAM and ConceptDraw MINDMAP with Management Diagrams and Mind Maps (decision making, scheduling, thinking ideas, problem solving, business planning, company organizing, SWOT analysis, preparing and holding meetings
 Value Stream Mapping
Value stream mapping solution extends ConceptDraw DIAGRAM software with templates, samples and vector stencils for drawing the Value Stream Maps (VSM) in lean manufacturing practice.
 Cisco Network Diagrams
Cisco Network Diagrams solution extends ConceptDraw DIAGRAM with the best characteristics of network diagramming software. Included samples, templates and libraries of built-in standardized vector Cisco network icons and Cisco symbols of computers, network devices, network appliances and other Cisco network equipment will help network engineers, network designers, network and system administrators, as well as other IT professionals and corporate IT departments to diagram efficiently the network infrastructure, to visualize computer networks topologies, to design Cisco computer networks, and to create professional-looking Cisco Computer network diagrams, Cisco network designs and schematics, Network maps, and Network topology diagrams in minutes.
 Cross-Functional Flowcharts
Cross-functional flowcharts are powerful and useful tool for visualizing and analyzing complex business processes which requires involvement of multiple people, teams or even departments. They let clearly represent a sequence of the process steps, the order of operations, relationships between processes and responsible functional units (such as departments or positions).
 Quality Mind Map
This solution extends ConceptDraw MINDMAP software with Quality Management Mind Maps (Presentations, Meeting Agendas, Problem to be solved).
 Marketing Diagrams
Marketing Diagrams solution extends ConceptDraw DIAGRAM diagramming software with abundance of samples, templates and vector design elements intended for easy graphical visualization and drawing different types of Marketing diagrams and graphs, including Branding Strategies Diagram, Five Forces Model Diagram, Decision Tree Diagram, Puzzle Diagram, Step Diagram, Process Chart, Strategy Map, Funnel Diagram, Value Chain Diagram, Ladder of Customer Loyalty Diagram, Leaky Bucket Diagram, Promotional Mix Diagram, Service-Goods Continuum Diagram, Six Markets Model Diagram, Sources of Customer Satisfaction Diagram, etc. Analyze effectively the marketing activity of your company and apply the optimal marketing methods with ConceptDraw DIAGRAM software.
 Social Media Response
This solution extends ConceptDraw DIAGRAM and ConceptDraw MINDMAP with the ability to draw interactive flow charts with action mind map templates, to help create an effective response to applicable social media mentions.
 ConceptDraw Solution Park
ConceptDraw Solution Park collects graphic extensions, examples and learning materials
 Visio Exchange
Our Visio Exchange tool allows you to Import and export native MS Visio 2013 files that are in the new MS Visio drawing (VSDX) format introduced in the most recent Visio iteration. In addition, ConceptDraw DIAGRAM supports the import and export of MS Visio 2007-2010 XML. (VDX) files more accurately then previous versions of ConceptDraw DIAGRAM. If you have the older MS Visio 2007-2010.
Business diagrams & Org Charts with ConceptDraw DIAGRAM
The business diagrams are in great demand, they describe the business processes, business tasks and activities which are executed to achieve specific organizational and business goals, increase productivity, reduce costs and errors. They let research and better understand the business processes. ConceptDraw DIAGRAM is a powerful professional cross-platform business graphics and business flowcharting tool which contains hundreds of built-in collections of task-specific vector stencils and templates. They will help you to visualize and structure information, create various Business flowcharts, maps and diagrams with minimal efforts, and add them to your documents and presentations to make them successful. Among them are Data flow diagrams, Organization charts, Business process workflow diagrams, Audit flowcharts, Cause and Effect diagrams, IDEF business process diagrams, Cross-functional flowcharts, PERT charts, Timeline diagrams, Calendars, Marketing diagrams, Pyramids, Target diagrams, Venn diagrams, Comparison charts, Analysis charts, Dashboards, and many more. Being a cross-platform application, ConceptDraw DIAGRAM is very secure, handy, free of bloatware and one of the best alternatives to Visio for Mac users.
- Fishbone Diagram | Business Productivity Diagramming | Service 8 ...
- SWOT analysis matrix diagram examples | SWOT Analysis Solution ...
- Business Productivity Diagramming | Fishbone Diagram | Cause ...
- Cause and Effect Analysis ( Fishbone Diagrams) | Fishbone Diagram ...
- Fishbone Diagram | Business Productivity Diagramming | Service 8 ...
- Fishbone Diagram | Business Productivity Diagramming | Cause ...
- Fishbone Diagram | Business Diagram Software | Diagramming tool ...
- Fishbone Diagram | Cause and Effect Analysis ( Fishbone Diagrams ...
- Workflow Process Example | Fishbone Diagram | Process Flowchart |
- Fishbone Diagram | Cause and Effect Analysis ( Fishbone Diagrams ...
- Cause and Effect Analysis ( Fishbone Diagrams) | Business ...
- Fishbone Diagram | Telecommunication Network Diagrams | Cisco ...
- Fishbone Diagram | Business Productivity Diagramming | Cause ...
- Fishbone Diagram | Management | ConceptDraw Solution Park |
- Pyramid Chart Examples | Marketing Diagrams | Fishbone Diagram |
- Fishbone Diagram | Business Productivity Diagramming | Business ...
- Business Productivity Diagramming | Cause and Effect Analysis ...
- Business Productivity Diagramming | Fishbone Diagram | Business ...
- SWOT Sample in Computers | SWOT Analysis | Fishbone Diagram |
- Cause and Effect Analysis ( Fishbone Diagrams) | Fishbone Diagram ...

