 Entity-Relationship Diagram (ERD)
Entity-Relationship Diagram (ERD) solution extends ConceptDraw DIAGRAM software with templates, samples and libraries of vector stencils from drawing the ER-diagrams by Chen's and crow’s foot notations.
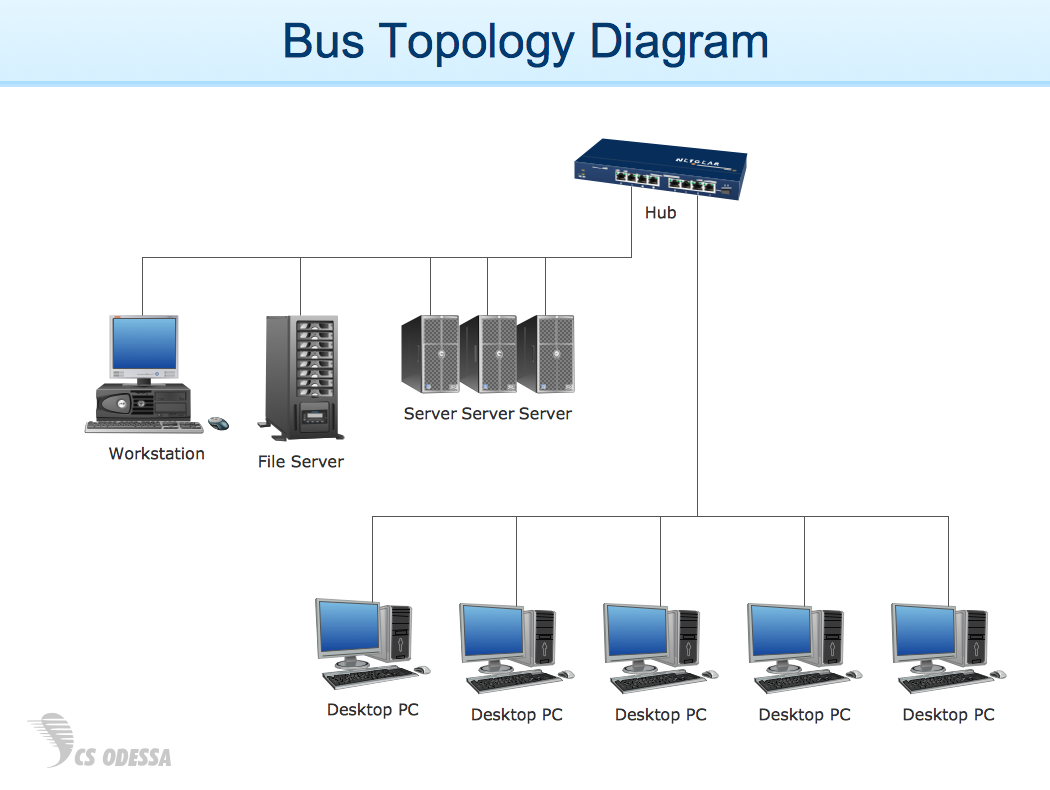
Network Diagram Examples
Network diagram is a chart which represents nodes and connections between them in computer network or any telecommunication network, it is a visual depiction of network architecture, physical or logical network topology. There are used common icons for the Network diagrams design, such as icons of various network appliances, computer devices, routers, clouds, peripheral devices, digital devices, etc. Network diagrams can represent networks of different scales (LAN level, WAN level) and detailization. ConceptDraw DIAGRAM diagramming software enhanced with Computer Network Diagrams solution from Computer and Networks area includes huge collection of computer and network templates, design objects and stencils, and numerous quantity of Network diagram examples and samples, among them: Basic Computer Network Diagrams, Communication Network Diagram, Wireless Router Network Diagram, LAN Topology Diagram, Computer Network System Design Diagram, Mobile Satellite Communication Network, Web-based Network Diagram, Hybrid Network Diagram, and many others.
 Fishbone Diagram
Fishbone Diagrams solution extends ConceptDraw DIAGRAM software with templates, samples and library of vector stencils for drawing the Ishikawa diagrams for cause and effect analysis.
 Event-driven Process Chain Diagrams
Event-Driven Process Chain Diagrams solution extends ConceptDraw DIAGRAM functionality with event driven process chain templates, samples of EPC engineering and modeling the business processes, and a vector shape library for drawing the EPC diagrams and EPC flowcharts of any complexity. It is one of EPC IT solutions that assist the marketing experts, business specialists, engineers, educators and researchers in resources planning and improving the business processes using the EPC flowchart or EPC diagram. Use the EPC solutions tools to construct the chain of events and functions, to illustrate the structure of a business process control flow, to describe people and tasks for execution the business processes, to identify the inefficient businesses processes and measures required to make them efficient.
 Value Stream Mapping
Value stream mapping solution extends ConceptDraw DIAGRAM software with templates, samples and vector stencils for drawing the Value Stream Maps (VSM) in lean manufacturing practice.
- Example of Flowchart Diagram | Diagram Flow Chart | Flow Chart ...
- Example of Flowchart Diagram | Flowchart Program Mac | Best ...
- Cross-Functional Flowcharts | Flow Chart Diagram Examples ...
- Business Process Diagram | Example of Flowchart Diagram ...
- Business Productivity Diagramming | Pyramid Chart Examples ...
- Types of Flowchart - Overview | Basic Workflow Examples | Workflow ...
- Diagram Flow Chart | Example of Flowchart Diagram | Flowchart ...
- Flow Chart Diagram Examples | Example of Flowchart Diagram ...
- Flow process chart | Example Process Flow | Example of Flowchart ...
- Example of Flowchart Diagram | Flow Chart Diagram Examples ...
- Flow Chart Diagram Examples
- Cross-Functional Flowcharts | Example of Flowchart Diagram | Basic ...
- Example of Flowchart Diagram | How to Draw a Flowchart | Create a ...
- Business Productivity Diagramming | SWOT analysis matrix diagram ...
- Accounting Flowcharts | Example of Flowchart Diagram | Cross ...
- Example of Flowchart Diagram | Accounting Flowcharts | Cross ...
- Types of Flowchart - Overview | Data Flow Diagrams | Process ...
- Cross-Functional Flowcharts | Accounting Flowcharts | Example of ...
- Example of Flowchart Diagram
- Cross-Functional Flowcharts | Flowchart Program Mac | Example of ...
