HelpDesk
How To Create Cause and Effect (Fishbone) Diagram in MS Visio
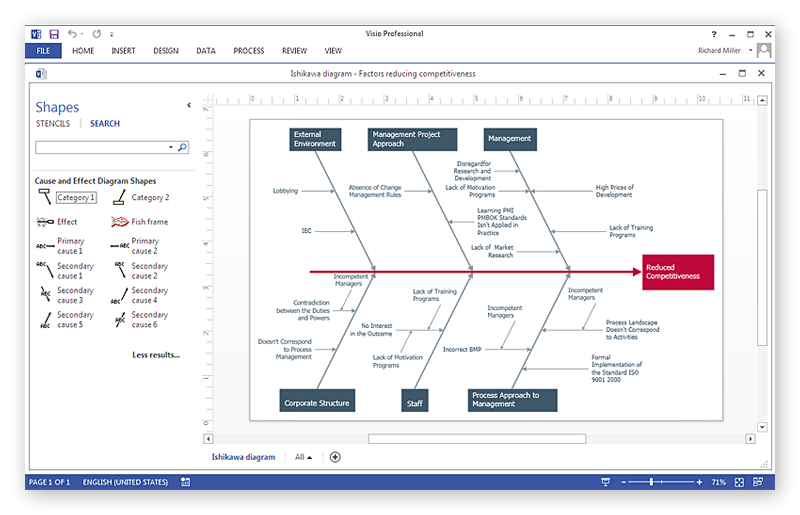
Cause-and-Effect Ishikawa Diagram is a graphical method of analysis and cause-effect relationships, a tool in the form of fish bone. It is used to systematically determine the cause of the problem and represent it graphically. The technique is primarily used in the framework of quality management for the analysis of quality problems and their causes. Nowadays, it has found worldwide distribution and is used in multiple problem areas. It is one of the tools of lean manufacturing, which is used in group work to find the problems and their causes. ConceptDraw PRO allows you to easily create Fishbone (Ishikawa) diagram and then make a MS Visio VSDX, or VSD files from your diagrams in a couple clicks, using the export capabilities of ConcewptDraw PRO.
 Fishbone Diagrams
The Fishbone Diagrams solution extends ConceptDraw PRO v10 software with the ability to easily draw the Fishbone Diagrams (Ishikawa Diagrams) to clearly see the cause and effect analysis and also problem solving. The vector graphic diagrams produced using this solution can be used in whitepapers, presentations, datasheets, posters, and published technical material.
HelpDesk
How to Create a Fishbone (Ishikawa) Diagram Quickly
A Fishbone (Ishikawa) diagram is also called cause-and-effect diagram. Fishbone diagram is often used in business to determine the cause of some problem. The diagram illustrates the main causes and sub-causes leading to an event. The main goal of the Fishbone diagram is to illustrate in a graphical way the relationship between a given outcome and all the factors that influence this outcome. The complete diagram resembles a fish skeleton as its name implies. The ability to create a Fishbone Diagram is supported by the Fishbone Diagram solution. Use ConceptDraw MINDMAP for structuring data and then ConceptDraw PRO for generating a Fishbone Diagram from mind map structure.HelpDesk
How to Draw a Fishbone Diagram with ConceptDraw PRO
Fishbone (Ishikawa) Diagram is often used in business to determine the cause of some problem. A Fishbone diagram is also called cause-and-effect diagram.The main goal of the Fishbone diagram is to illustrate in a graphical way the relationship between a given outcome and all the factors that influence this outcome. The complete diagram resembles a fish skeleton as its name implies. Cause and Effect analysis is used in management to identify the possible causes of a problem in order to eliminate them. The ability to create a Fishbone Diagram is supported by the Fishbone Diagram solution.HelpDesk
How to Add a Fishbone (Ishikawa) Diagram to a MS Word Document
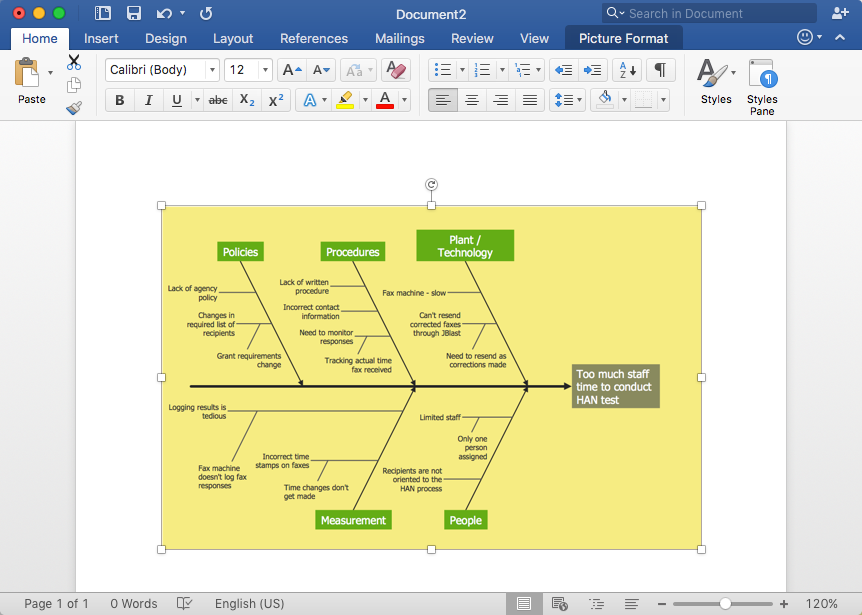
The ability to create a fishbone (Ishikawa) Diagram is supported by the ConceptDraw Fishbone Diagram solution. ConceptDraw PRO allows you to easily create a fishbone diagrams and then insert them into a MS Word document.In searching of alternative to MS Visio for MAC and PC with ConceptDraw PRO
Undoubtedly MS Visio is a powerful and multifunctional tool, but however at times occur the instances, when it turns unable of meeting certain users' requirements. At this cases you may need to use an alternative program software, preferably it will be simple, convenient, and at the same time powerful and professional. In searching the alternative to MS Visio for MAC and PC we recommend you to pay attention for ConceptDraw PRO software, which was developed to satisfy all your drawing needs and requirements. It is a fully-functioned alternative product to MS Visio for both platforms. ConceptDraw PRO software has many advantages, the main among them are the cross-platform compatibility, a reasonable price, widespread ConceptDraw Solution Park with huge variety of different solutions that offer numerous libraries of specialized vector objects, useful examples, samples, and quick-start templates, extensive import / export capabilities, built-in script language, MS Visio support and certainly free technical support.Venn Diagram Examples for Problem Solving. Environmental Social Science. Human Sustainability Confluence
The Venn diagram example below shows sustainable development at the confluence of three constituent parts. Create your Venn diagrams for problem solving in environmental social science using the ConceptDraw PRO diagramming and vector drawing software extended with the Venn Diagrams solution from the area "Diagrams" of ConceptDraw Solution Park.Process Flowchart
The main reason of using Process Flowchart or PFD is to show relations between major parts of the system. Process Flowcharts are used in process engineering and chemical industry where there is a requirement of depicting relationships between major components only and not include minor parts. Process Flowcharts for single unit or multiple units differ in their structure and implementation. ConceptDraw PRO is Professional business process mapping software for making Process flowcharts, Process flow diagram, Workflow diagram, flowcharts and technical illustrations for business documents and also comprehensive visio for mac application. Easier define and document basic work and data flows, financial, production and quality management processes to increase efficiency of your business with ConcepDraw PRO. Business process mapping software with Flowchart Maker ConceptDraw PRO includes extensive drawing tools, rich examples and templates, process flowchart symbols and shape libraries, smart connectors that allow you create the flowcharts of complex processes, process flow diagrams, procedures and information exchange. Process Flowchart Solution is project management workflow tools which is part ConceptDraw Project marketing project management software. Drawing charts, diagrams, and network layouts has long been the monopoly of Microsoft Visio, making Mac users to struggle when needing such visio alternative like visio for mac, it requires only to view features, make a minor edit to, or print a diagram or chart. Thankfully to MS Visio alternative like ConceptDraw PRO software, this is cross-platform charting and business process management tool, now visio alternative for making sort of visio diagram is not a problem anymore however many people still name it business process visio tools.
Workflow Diagram Template
Starting producing workflow diagram from template you save time and avoid the blank page syndrome. At first, the workflow template is set of rules for a workflow. The workflow symbols used in the specific case are part of workflow template. This is the subset of large standard collections of workflow symbols. The first part of workflow template is identification of symbols allowed in use in your specific case. The best way would be to collect them in your customized drawing collection of workflow symbols which used in your specific cases of workflow diagrams. Another way to create business process documents is using business process flow diagram which have similar purposes and have different visual notation. ConceptDraw PRO is professional workflow diagram software with the rich extentions from ConceptDraw Solution Park. The basic solution for workflow diagramming is Workflow Diagrams Solution. It delivers a rich set of workflow diagram templates and samples help you draw diagrams eBlank Calendar Template
The calendars around us everywhere in the modern world. There are a lot of calendar types, each of them has its own assignment: Business calendar, Personal calendar, Economic calendar, Financial calendar, Daily calendar, Monthly calendar, and many other useful calendar types. ConceptDraw PRO offers you the possibility to make your own unique calendars on the base of the Blank Calendar Template which is included to the Calendars Solution from the Management Area.Flowchart Software
Flowchart is a simple diagram, map or graphical schematic representation the sequence of actions within a process. It is ideal for displaying how a process currently flows or can function ideally. The Flowcharts let define the steps and boundaries of a process, uncover problems or miscommunications. The Flowcharts are widely used in education, software development, business, economics, thanks to their visuality they are ideal for presentations, reports, for using on conferences to help the audience comprehend the content better, or easy find flaws in a process flow diagrams. ConceptDraw PRO is professional flowcharts software and feature-rich flowchart maker, which supports Mac OS X and Windows. It contains at ConceptDraw Solution Park a rich set of stencils and professional flowchart symbols for design. It lets create simply professional-looking Flowcharts based on thousand free flowchart templates, colored symbols and examples. ConceptDraw PRO is a 3 times cheaper alternative to MS Visio available for both Mac and PC. It’s is another full featured business and technical diagramming application that can easily take care of Visio files within OS X. Another bonus with ConceptDraw PRO – it's cross-platform. You can work on a document in both OS X and Windows, skipping Visio entirely.
 ConceptDraw Solution Park
ConceptDraw Solution Park collects graphic extensions, examples and learning materials
 PM Response
The PM Response solution extends the functional abilities in project management for all three ConceptDraw products by helping to improve the response time to project changes, to plan on how to effectively respond on issues and events impacting the project. It supplies the project managers, team leaders, and all other project participants with wide abilities of iteration planning, creative collaboration, effective decision-making, discussions of the project layout approaches and solving the project challenges, lets them use mind mapping technique for iteration planning and applying the project changes, to represent the projects data as Mind Maps and use them to construct the clear plans, to convert project maps to project implementations, to use different kinds of Visual diagrams to solve the current project problems and to make correct decisions, to plan resources usage and to respond to changes in the project environment.
 Accounting Flowcharts
Accounting Flowcharts solution extends ConceptDraw PRO software with templates, samples and library of vector stencils for drawing the accounting flow charts.
- Fishbone Diagram | Business and Finance | ConceptDraw Solution ...
- Using Fishbone Diagrams for Problem Solving | Venn Diagram ...
- Fishbone Diagrams | Fishbone Diagram Problem Solving ...
- Fishbone Diagram | Entity-Relationship Diagram (ERD) | Business ...
- Fishbone diagram - Bad coffee | Fishbone Diagrams | Fishbone ...
- Fishbone Diagram | Holiday | Cisco Network Diagrams | Example Of ...
- Fishbone Diagrams | How Do Fishbone Diagrams Solve ...
- Fishbone Diagrams | Illustration | Presentation Clipart | Fishbone ...
- Draw Fishbone Diagram on MAC Software | Fishbone Diagram ...
- Illustration | Business Productivity Area | Business and Finance ...
- Bar Diagrams for Problem Solving. Create economics and financial ...
- Cause and Effect Analysis - Fishbone Diagrams for Problem Solving ...
- Bar Diagrams for Problem Solving. Create economics and financial ...
- Venn Diagram Examples for Problem Solving. Venn Diagram as a ...
- Class Diagram For Finance Management
- Ishikawa Diagram | Total Quality Management Value | Using ...
- Process Flowchart | Audit Steps | Flow chart Example . Warehouse ...
- Fishbone Diagram | Lean Manufacturing Diagrams | Bar Diagrams ...
- Venn Diagram Examples for Problem Solving. Computer Science ...
- Fishbone Diagram | Using Fishbone Diagrams for Problem Solving ...


