HelpDesk
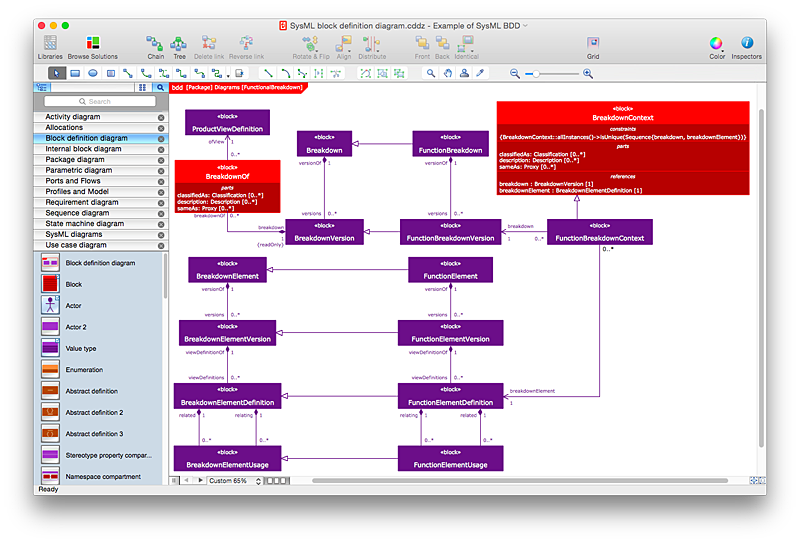
How to Create a SysML Diagram Using ConceptDraw PRO
Systems Modeling Language (SysML) is designed to use for system engineering. It is similar to UML, but much easier to learn. used by to system engineers what UML is to software engineers. Smaller in content and simpler to learn than UML. SysML is focused on standardizing the language used to describe engineering systems. SysML covers a broader range of systems, than can involve personnel, facilities, hardware or electrical components. SysML depicts system using the SysML diagrams. Making a SysML diagram involves many elements that can be managed using SysML solution for ConceptDraw PRO.DroidDia prime
Droiddia allows you to make flow charts org charts venn diagrams mindmaps and do other diagrams with no constrains and as little effort as possible.HelpDesk
How to Design an Interface Mock-up of an Android Application
Uses Interface prototyping is much convenient when you can work through a diagram similar to the device design. ConceptDraw PRO allows you to develop Android User Interface (UI) prototypes using the special templates and vector libraries of the specific user interface elements. Using ConceptDraw PRO you can mock-up an Android UI system so that you can figure out how best to represent user interface (UI) elements for the development of a new mobile Apps.HelpDesk
How to Create a Network Security Diagram Using ConceptDraw PRO
Network security requires constant work and attention to details. Each user, whether an individual or organization, owns an information, considered to be valuable. The enforcement of network security, whether it be a local network security, or wireless network security is core for creating the secure environment of the daily working processes. Network security is accomplished through hardware and software. Network security system must be sophisticated and modern inside, but simple and understandable for the user. The visual scheme of security system can be presented in the form of a Network Security diagram. ConceptDraw PRO provides the toolkit for network security system visualization with its Network Security Diagram solution.HelpDesk
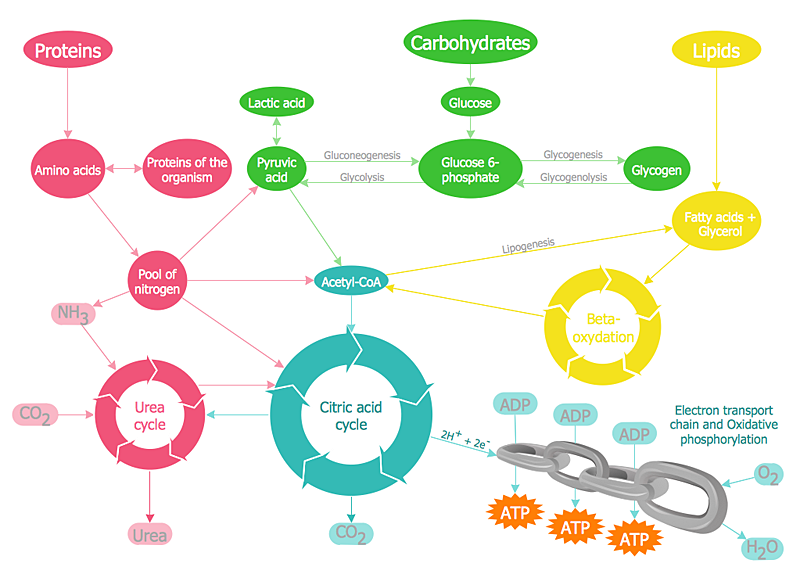
How to Draw Biology Diagram in ConceptDraw PRO
Biology is the science studying the living forms of life. A good starting point when studying biology is to use drawings. Drawings help students to comprehend and remember knowledge that is difficult to explain and understand. Students are used to draw various specific diagrams such as the human circulatory systems or schemes of various biochemical processes. Researchers also need to complete their work with a variety of related diagrams and illustrations. ConceptDraw Biology solution allows you to draw various biological diagrams and schemes easily.Cross Functional Flowchart for Business Process Mapping
Start your business process mapping with conceptDraw PRO and its Arrows10 Technology. Creating a process map, also called a flowchart, is a major component of Six Sigma process management and improvement. Use Cross-Functional Flowchart drawing software for business process mapping (BPM). Use a variety of drawing tools, smart connectors and shape libraries to create flowcharts of complex processes, procedures and information exchange. Define and document basic work and data flows, financial, production and quality management processes to increase efficiency of you business.HelpDesk
How to Create Education Infographics
Education Infographics is used to display a lot of education-related information in a single, visually-appealing graphic. Infographics, created for education purposes can contain different illustrations, detailed charts, and data. ConceptDraw PRO can be used as a tool for creating education infographics. It allows you to draw infographics quickly and easily using the special templates and vector stencils libraries. Infographics can be used to quickly communicate a message, to simplify the presentation of large amounts of data, to see data patterns and relationships, and to monitor changes in variables over time. It can contain bar graphs, pie charts, histograms, line charts, e.t.c.- Process Flowchart | Free Press Tool Design Assembly Sample ...
- Model Press Tool Diagram
- Examples Of Tools For Assembly Drawing
- Engineering Graphics Tool For The Mind Solutions
- Sample Assembly Drawing
- Examples Of Assembly Drawings
- Assembly Drawings Example
- Samples Of Technical Drawings In Pdf Format
- Example Of Assembly Flow Chart
- Designing Flow Chart On Assembly
- How to Create a Mechanical Diagram | Mechanical Drawing ...
- Process Flowchart | Cross-Functional Flowchart | Mechanical ...
- Toolbar control elements - Vector stencils library | Design elements ...
- Design elements - Android system icons (toggle) | Switches - Vector ...
- UML Diagram | Diagramming Software for Design UML ...
- Android UI Design Tool | Mac OS User Interface Design Examples ...
- Mac OS User Interface Design Examples
- Android UI Design Tool | Android GUI | GUI Interface | Gui Samples
- Android UI Design Tool | Android UI Design | ConceptDraw graphic ...

.jpg)


